

dsh-usage-statistics
Manifest validA DeepSeek Harness plugin adding per-day and per-hour token usage, cache hit rate, and a live request log (用量统计)
English | 中文
dsh-usage-statistics
A community plugin for DeepSeek Harness that adds a 用量统计 / Usage statistics page to the left rail: per-day and per-hour token usage, the cache hit rate, and a live request log that updates the moment a reply settles.
It is not an official DeepSeek package. It is a profile bundle: one directory, plain JavaScript, no build step, no dependencies, no network calls.
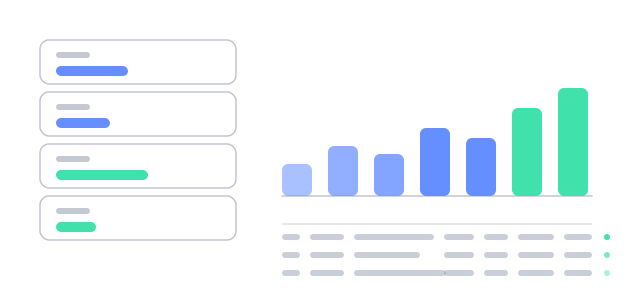
What the page shows
- Range toolbar — today (the default), the last 7 days, the last 30 days, or any two dates of your own.
- Three headline figures — the range total (split into new input, cache traffic, and output), the request count with the average per request, and the cache hit rate.
- A vertical histogram — one column per day, or per hour when the range is a single day, with cache misses grey, cache hits green, and output orange. Hovering a column for one second shows the exact numbers behind it.
- A live request log — the newest requests in the range with time, directory, provider, model, new
input, cache read, output, speed (tokens/second), and first-token latency. Token counts print in
万/亿 (
930,435,062reads as9.3亿) and keep the exact number on hover. A row that arrives while you watch pops in with a flashing border. - A pinned bottom bar — today's live figures, whatever range the rest of the page is showing.
Install
git clone https://github.com/xq25478/dsh-usage-statistics.git ~/dsh-plugins/dsh-usage-statistics
Then in DeepSeek Harness open Plugins → Add plugin and pick that directory, or install the path directly:
plugin_manager install_bundle target=~/dsh-plugins/dsh-usage-statistics
The plugin appears in the left rail as a bar-chart icon below the session list. It needs DeepSeek
Harness 0.2.2-rc.3 or newer; it reads ~/.dsh/sessions and nothing else.
Units
Every token count prints in 万 (ten thousand) and 亿 (a hundred million), one system in every language:
930,435,062 reads as 9.3亿, 4,562,325 as 456.2万, and anything under ten thousand stays exact.
The exact value stays in the hover text, the tooltip, and the accessible name.
How it updates
There is no polling. On open, the page holds one NDJSON stream to the Host
(/api/usage-statistics/stream); the Host pushes a fresh snapshot whenever a reply settles,
coalescing bursts into one push per 400 ms and sending a heartbeat every 20 s. A quiet stream is
reopened after 1.5 s, a stream that has delivered nothing for 45 s is treated as dead, and returning
to the tab asks for a fresh snapshot. The log header shows the time of the last push, so a stalled
channel is visible instead of silent.
Data sources
Every number comes from one place: the usage block that the model call itself reports, written by
the agent loop into the durable session log. Nothing is estimated, sampled, or inferred from message
text.
| Layer | What it provides | Where it comes from |
|---|---|---|
| Usage counts | inputTokens (uncached prompt), cacheReadTokens, cacheWriteTokens, outputTokens, and the provider's own total | The provider response, mapped by the active LLM adapter into the harness TokenUsage shape, whose counts are documented as disjoint |
| Event time | The instant the reply settled, in epoch milliseconds | The session event envelope (event.time) |
| Corpus | Which sessions exist | ctx.sessionQuery.listSessions() |
| Log bodies | Every committed event of one session, including fork seed metadata | ctx.sessionQuery.readSession(id): the Host reads and replay-validates the JSONL, zstd frames included; this plugin never parses or decompresses a log itself |
| Live increments | New replies while the page is open | The session/event feed, fanned out to open streams as a snapshot push |
| Day boundary | Which day a sample belongs to | The Host process's local calendar date (Intl zone) |
| Range | Which days are in view | from/to local day keys, or a days count; the Host caps a range at 366 days and reads a reversed pair the way it was meant |
Why the totals can be trusted
- They are the provider's own numbers, and the arithmetic reproduces the provider's total. In one
real corpus, 1,755 records carried both the four counts and the provider's
totalTokens; the four-count sum equalstotalTokensin every one of them (absolute difference 0). The only aggregate gap was exactly the five older records that report nototalTokensat all. - Replacement, not double counting. A streamed sample for a step is replaced by that step's
settlement, so one request counts once;
llm/retry-startedreopens the slot so a retried attempt counts on its own. - Forks do not bill twice. A seeded session's inherited events are skipped
(
inheritedEventCount), so a fork never re-adds its parent's history. - Cross-checked per session. For every session, the ledger's total equals the raw sum of that
session's
assistant/message.usagefields.
What is not guaranteed
- A reply whose provider reports no usage adds nothing, so the page can only undercount.
- Usage is attributed to the day the reply settled; a request that starts before midnight and finishes after it lands on the second day.
- Sessions written by another Host process while this one runs are not picked up until a restart; the page states how many sessions and usage records its scan covered.
- Cache fields exist only when the provider reports them.
- Token counts are not currency. Pricing, discounts, and cache-read surcharges live with the provider's billing console.
Speed and first-token latency
- Speed is
outputTokens / (last output chunk − first output chunk). - First-token latency is
first output chunk − step start.
Both read the timestamps the stream recorder stamps on every chunk, so they share the session clock
rather than a second one. A reply with no output chunk, or a decode window shorter than 200 ms, shows
— instead of a meaningless rate.
Files
| File | Role |
|---|---|
index.js | Host entry: owns the ledger, the live event feed, the snapshot route, and the stream route |
ledger.js | The fold itself: pure event-to-day/hour/request aggregation, no Harness imports |
client.js | Browser module: the rail icon and the page |
cordis.patch.yml | The one Loader row this bundle inserts |
locale/ | Plugin title, description, and detail document path per language |
docs/ | Feature image and the detail documents |
tests/ | Node checks: fold rules, the Host entry against a real corpus, and the page's render path |
Tests
node tests/ledger.test.mjs   # replacement, retry, fork seed, midnight, ranges, hourly buckets
node tests/client.test.mjs   # registrations, dictionaries, theme tokens, render path
node tests/host.test.mjs     # the Host entry mounted on this machine's sessions (needs `zstd`)
The Host test reads the local session corpus; it prints the figures the page would show and asserts the routes, the push stream, and the row limit.
License
MIT. See LICENSE.
A community plugin, not an official DeepSeek package. Built and verified with DeepSeek Harness.

Comments
Loading…
Similar plugins
by iuuuuuuuu
DSH plugin: per-day token usage and time-to-first-token statistics, broken down by workspace and session. Reads local session logs only.
★ 0
MIT
JavaScript
Sep 16, 2026
dsh plugin --profile web add dsh-usage-statsby xchannel1987
Token usage statistics plugin for DeepSeek Harness - today's token consumption by model, cache hit rate, 7-day trend chart, optional header badge, persistent storage with auto cleanup.
★ 0
↓ 239/wk
MIT
JavaScript
Sep 24, 2026
dsh plugin --profile web add dsh-token-usage-xcby XEsx630
All-session token usage statistics for DeepSeek Harness
★ 0
MIT
JavaScript
Oct 20, 2026
dsh plugin --profile web add dsh-usage-statsby cute-baobao
DeepSeek Harness usage recorder plugin: per-model hourly token usage (input/output/cache hits) with a stacked bar chart dashboard in the Web GUI.
★ 3
↓ 72/wk
MIT
TypeScript
Aug 14, 2026
dsh plugin --profile web add @dsh-usage-meter/usageby ChrisLou-bioinfo
DSH plugin: token usage statistics across all sessions as a settings page (zero-dep, no build)
★ 0
MIT
JavaScript
Oct 8, 2026
dsh plugin --profile web add dsh-usage-liteby vaspike
Token usage statistics for DeepSeek Harness: per-route tokens, cache hit rate, TPS, and a GitHub-style usage heatmap
★ 0
MIT
JavaScript
Nov 17, 2026
dsh plugin --profile web add dsh-usage-stat