

dsh-usage-stat
Manifest validToken usage statistics for DeepSeek Harness: per-route tokens, cache hit rate, TPS, and a GitHub-style usage heatmap
dsh-usage-stat
English | 中文
Token usage statistics for DeepSeek Harness. Adds a Usage Stat panel to the left sidebar — the same global-panel mechanism as Plugins.
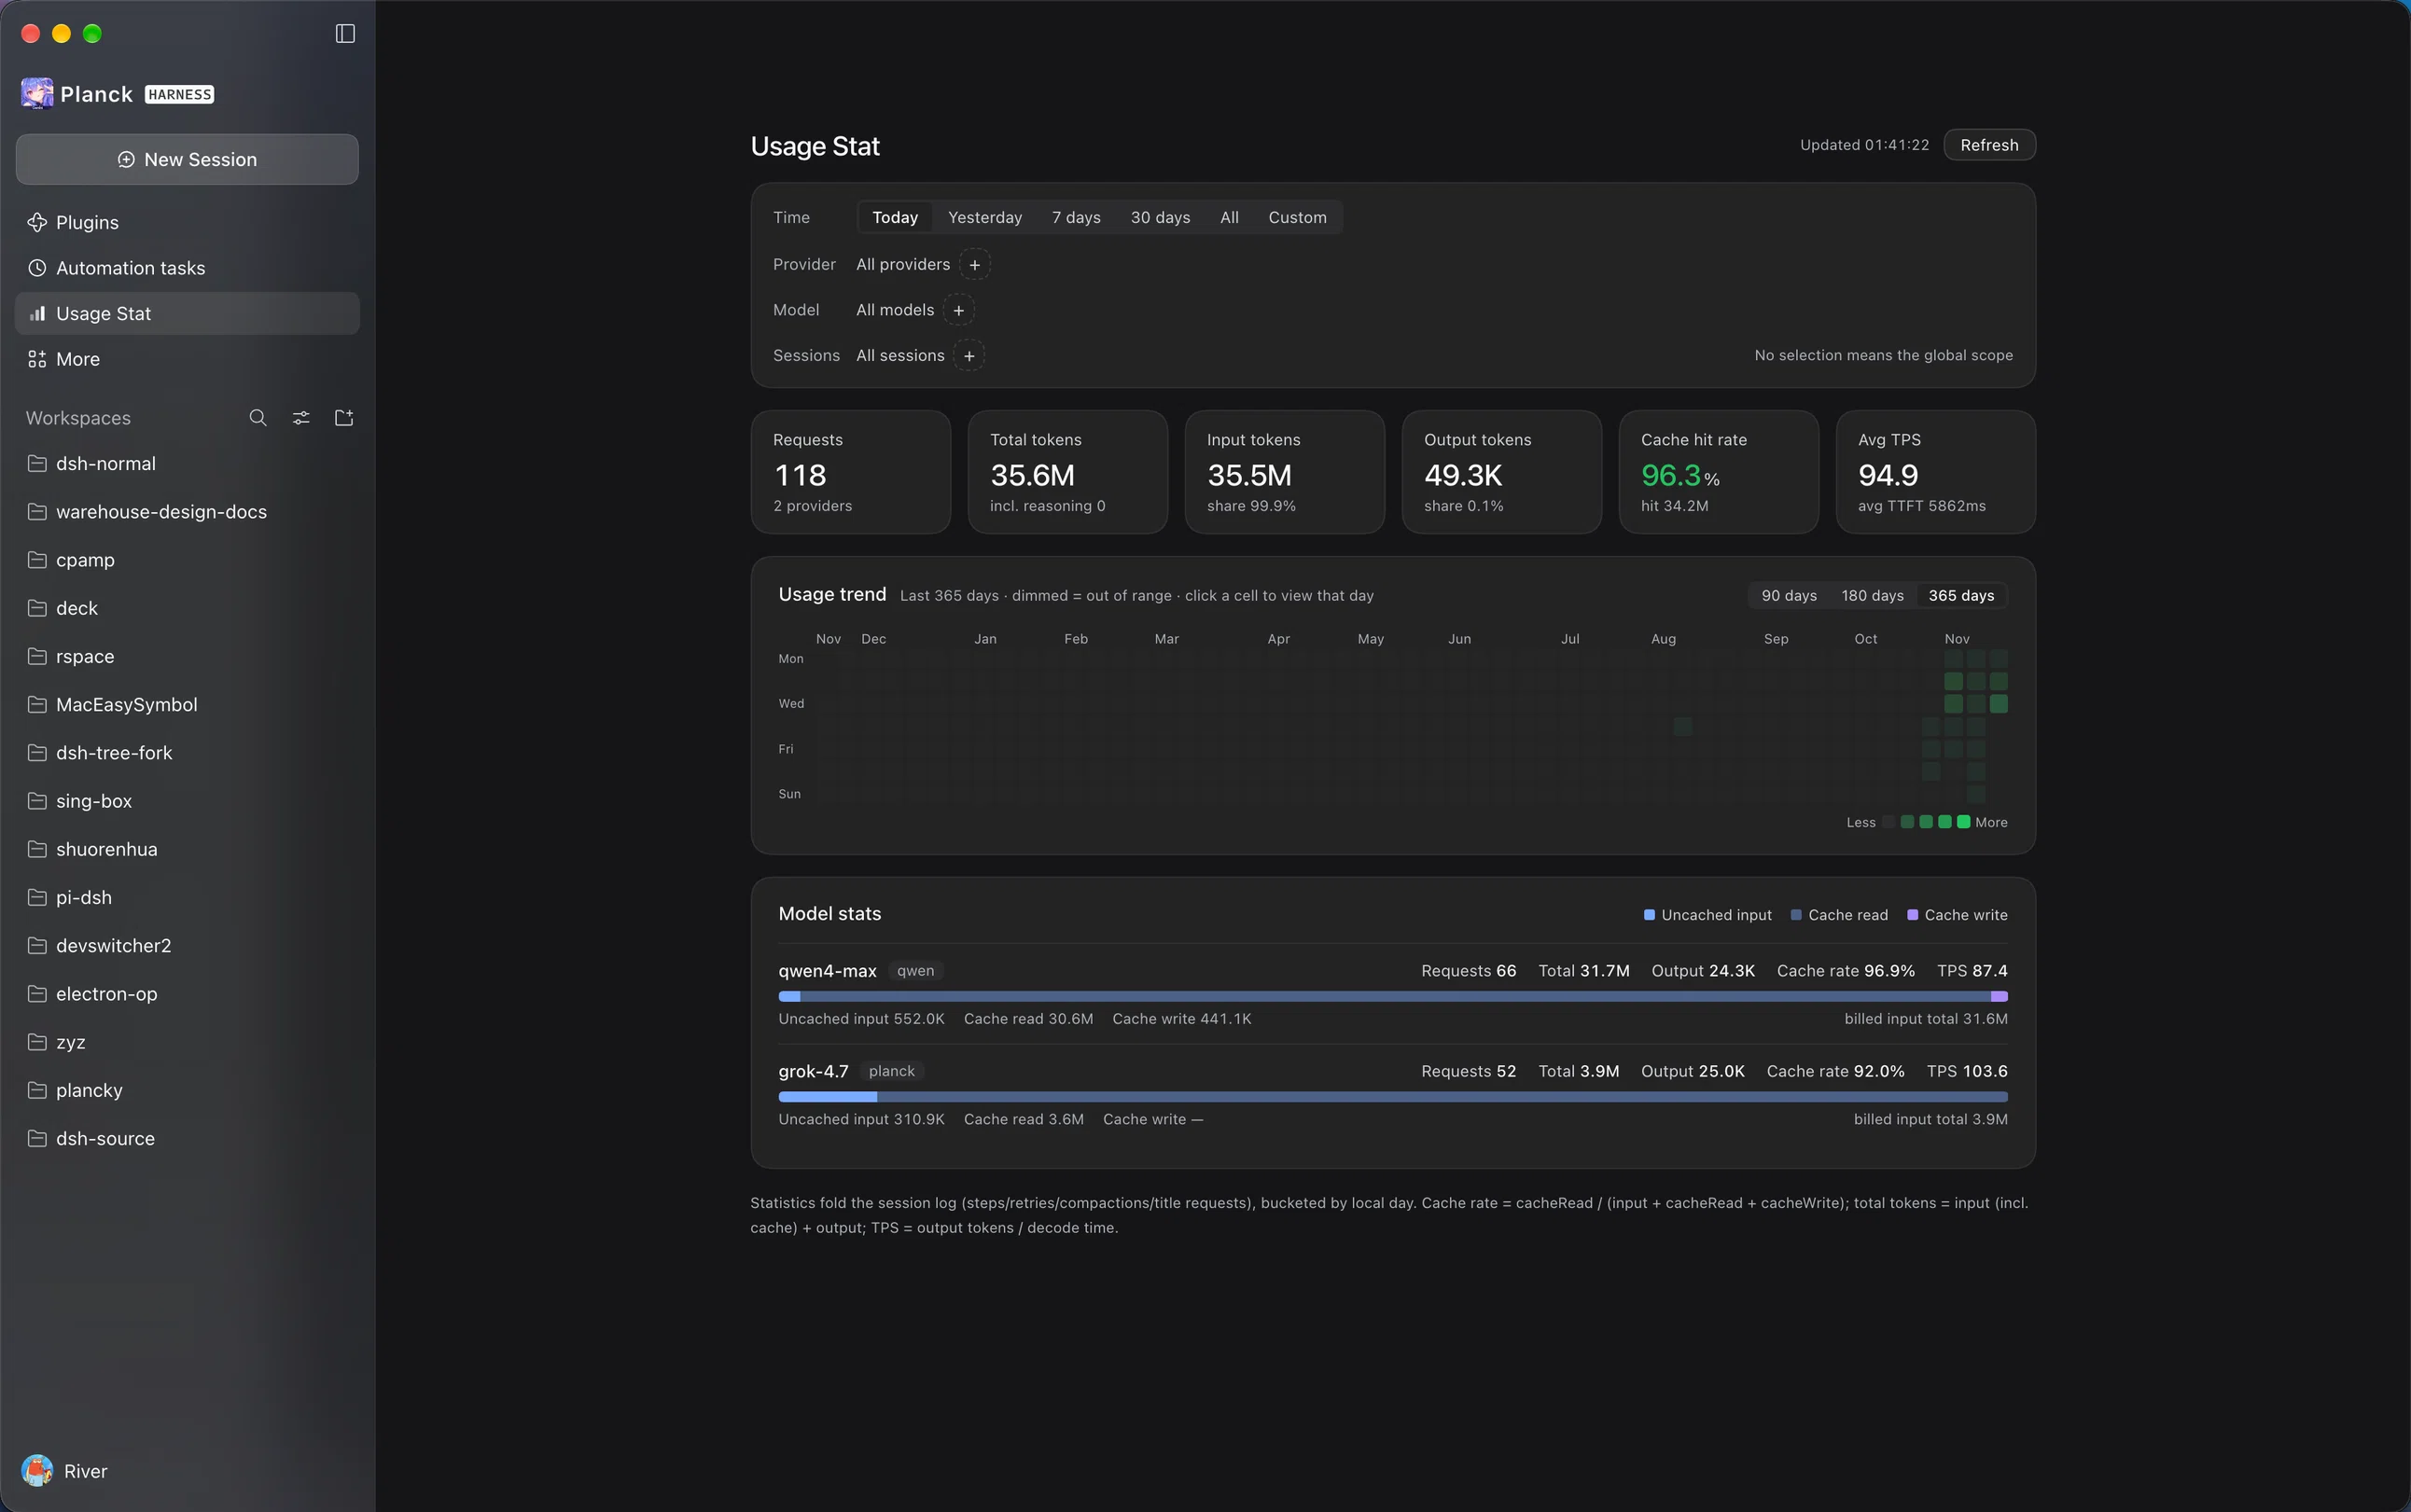
Dark theme
Features
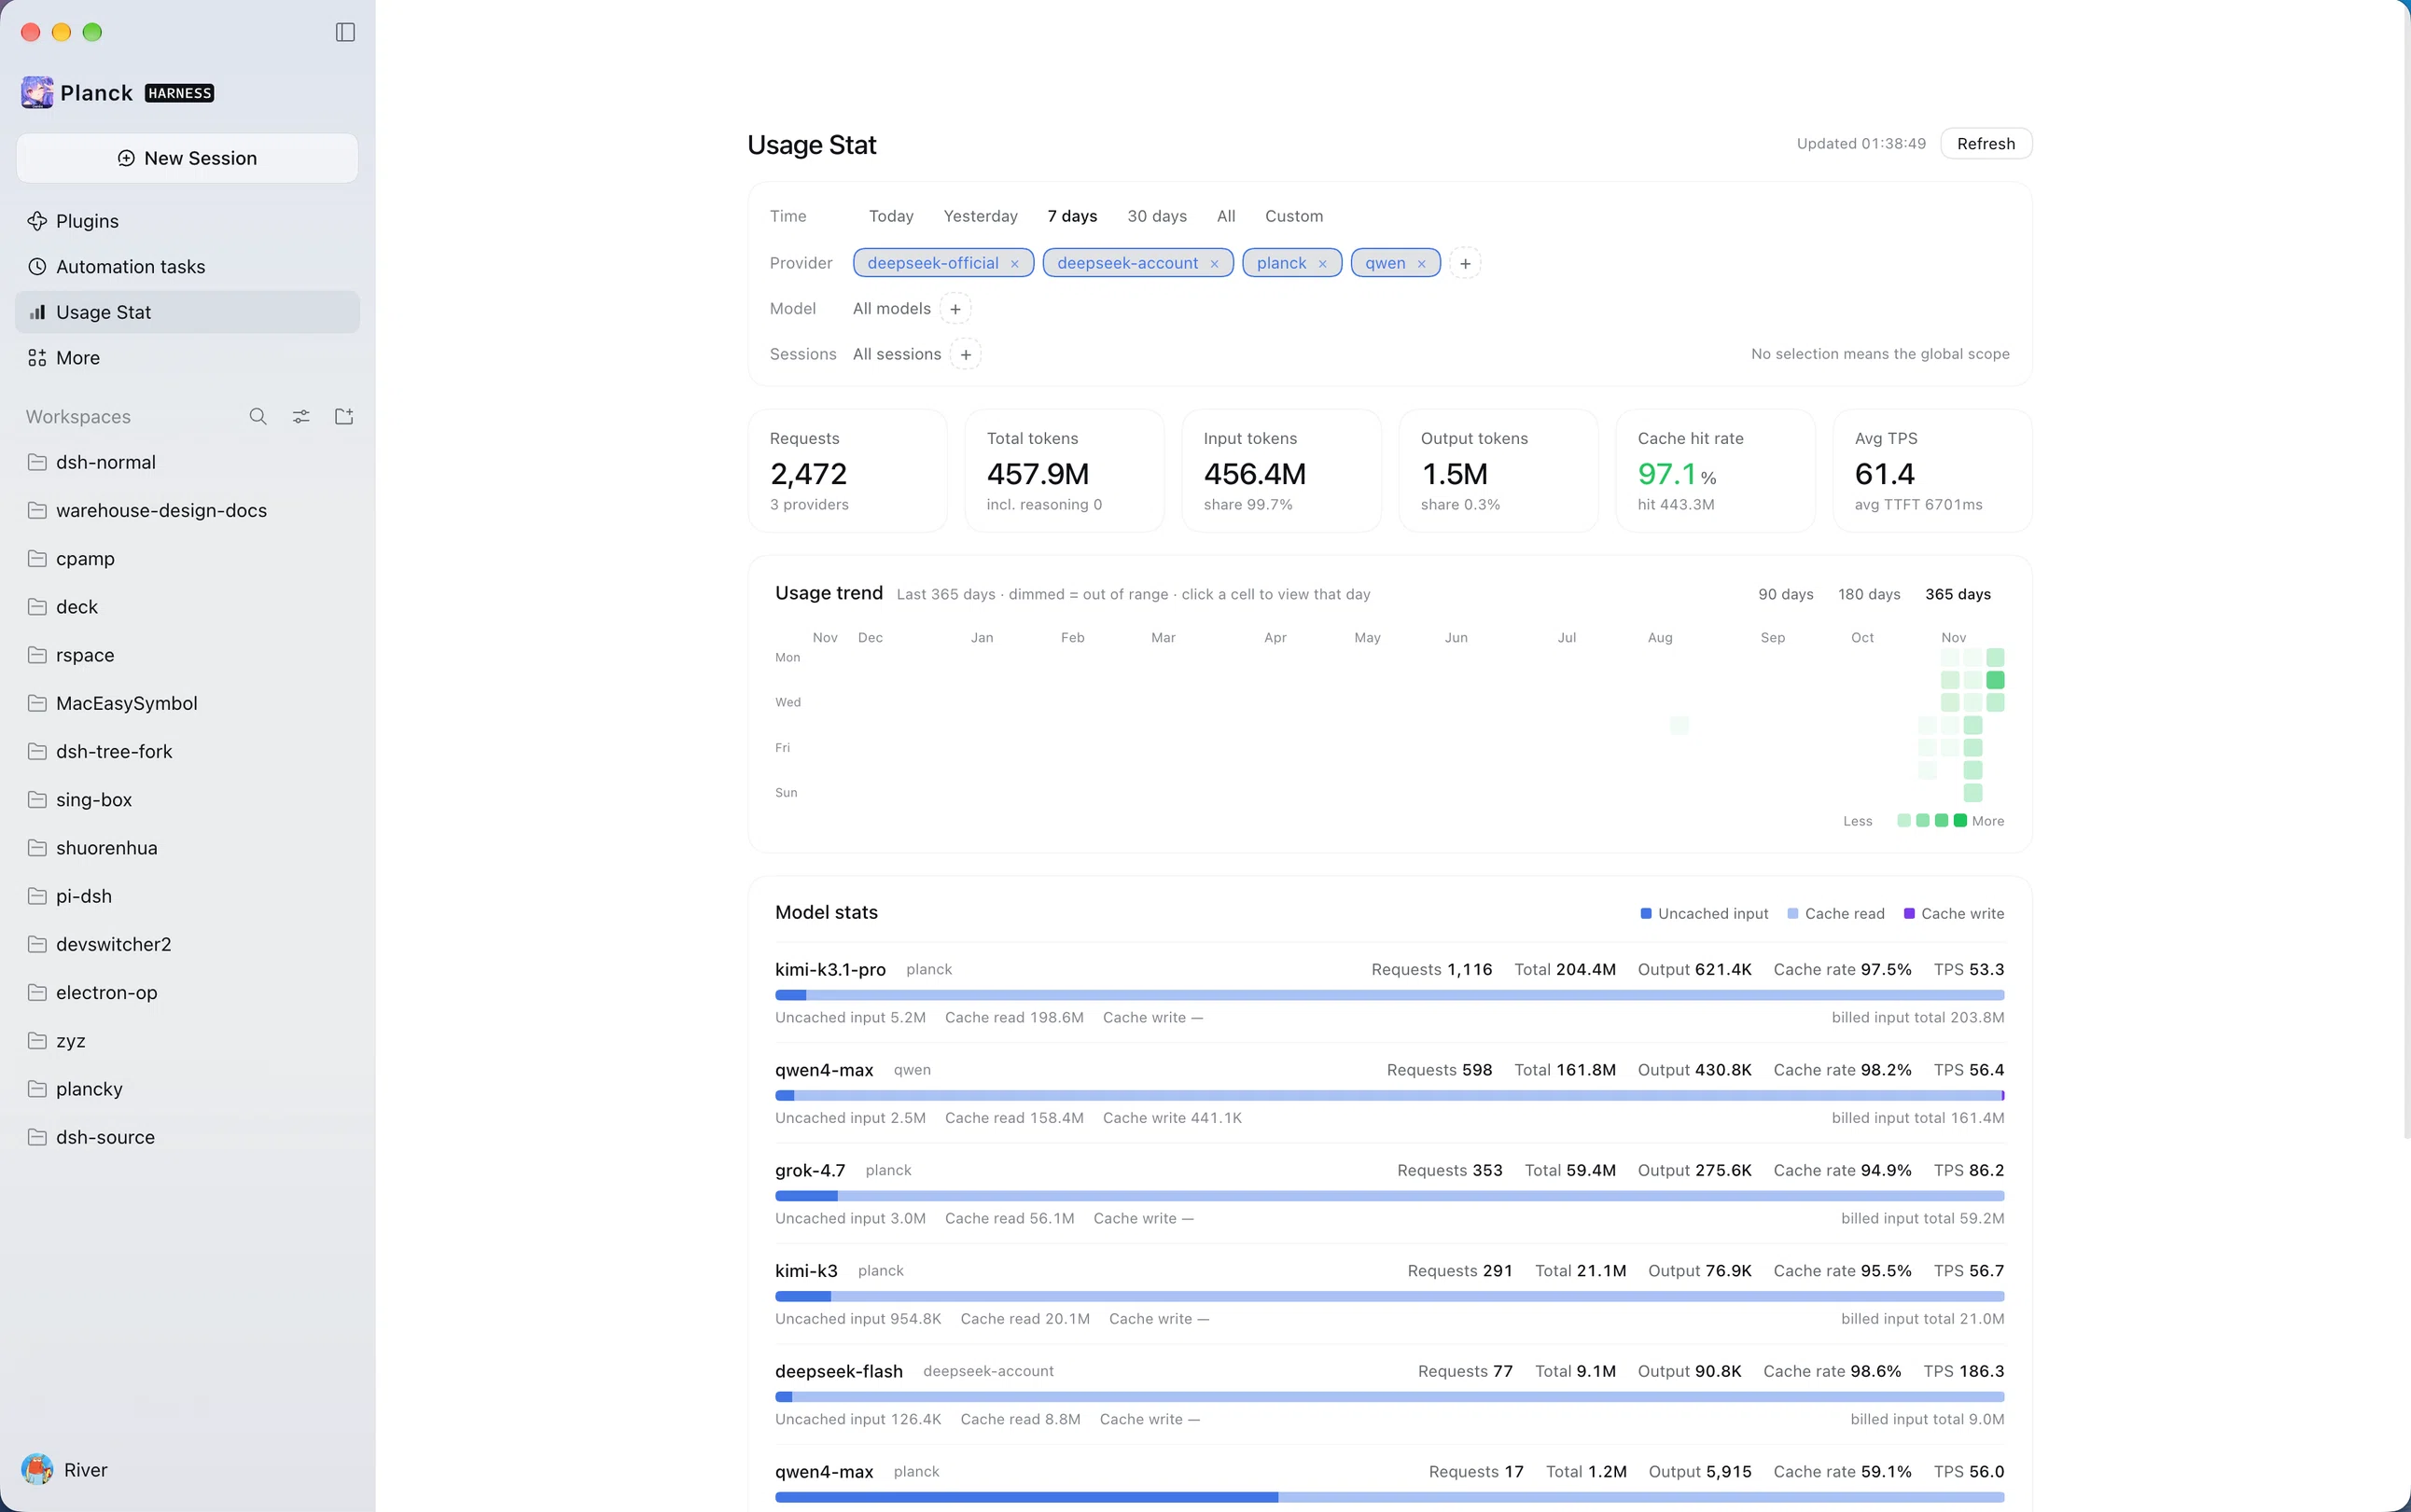
- KPIs — request count (provider count; step/retry/compaction/aux breakdown on hover), total tokens (incl. reasoning), total input tokens with share, output tokens with share, cache hit rate, average TPS with TTFT.
- Filters — time presets (today / yesterday / 7 days / 30 days / all) plus a custom date range; provider, model, and session multi-selects. No session selection means the global scope.
- Usage heatmap — GitHub-style, 90 / 180 / 365-day windows (default 365). Cell size adapts to the panel width; click a cell to jump to that day; out-of-range days render dimmed.
- Model stats — per provider × model route: request count, total tokens, output, cache rate, TPS, and a disjoint input / cache-read / cache-write composition bar with the billed-input total.
- Theme-friendly — styling consumes
--dsw-alias-*semantic tokens only, so light/dark and user-registered custom themes apply unchanged.
Install
From the plugin market, or manually: Plugins → Add plugin and enter dsh-usage-stat (npm) or a local checkout directory. Requires DeepSeek Harness 0.2.x.
How it counts
The host folds committed session events into a per-day, per-session, per-(provider, model) ledger:
| Kind | Source event | Notes |
|---|---|---|
| Steps | step/end | Attributed to the step's assistant-message route |
| Retries | llm/retry-started | An attempt actually dispatched after a failed request |
| Compactions | compaction/summary | With its provider-reported usage |
| Aux | session/title-llm-request | Title generation and other auxiliary calls |
Token buckets use the disjoint TokenUsage accounting:
- input excludes cache reads/writes; cache hit rate = cacheRead / (input + cacheRead + cacheWrite);
- total tokens = input (incl. cache) + output;
- TPS = output tokens / decode time; TTFT = step start → first non-empty text/reasoning delta, both derived from the timestamped stream embedded in
assistant/message.
Reasoning tokens appear only for routes whose API reports them explicitly (e.g. DeepSeek reasoner); a zero means "not reported", not "no reasoning". Cache-write tokens appear only for APIs that report cache creation explicitly (e.g. Anthropic); implicit-prefix-cache providers report reads only.
Durability
Every contributing event is appended to a JSONL ledger keyed by (sessionId, seq) with explicit history-coverage markers. Restarts replay it, and stored history is backfilled through sessionPersistence/sessionQuery without double-counting; gaps left by transient read failures heal on the next run. The ledger lives at $DSH_PROFILE_DIR/usage-stat/ledger.jsonl (or ~/.dsh/usage-stat/ledger.jsonl), overridable via the row's dataFile config.
Deleting a provider or model never loses history: routes are recorded as strings at request time, and removed routes stay filterable.
An llm/stream waterfall listener adds real-time coverage for purpose-tagged auxiliary calls (title-call usage, failed compaction attempts, other declared purposes). Loop requests pass through untouched. The browser panel reads one authenticated route, /usage-stat/api/snapshot, and refreshes every 30 s.
Known limitations
- Usage from attempts that never assembled an assistant message (e.g. cancelled mid-stream) is not counted; such steps are hidden from display as unknown routes.
- Auxiliary-call usage is counted only while the plugin runs; it cannot be backfilled from logs.
- Sessions in a format requiring migration are skipped by backfill.
- Day buckets use the Host's local timezone.
Development
node tests/usage-stat.test.mjs # fold, ledger, waterfall, client helpers
License
MIT
Comments
Loading…
Similar plugins
by XEsx630
All-session token usage statistics for DeepSeek Harness
★ 0
MIT
JavaScript
Oct 20, 2026
dsh plugin --profile web add dsh-usage-statsby xchannel1987
Token usage statistics plugin for DeepSeek Harness - today's token consumption by model, cache hit rate, 7-day trend chart, optional header badge, persistent storage with auto cleanup.
★ 0
↓ 239/wk
MIT
JavaScript
Sep 24, 2026
dsh plugin --profile web add dsh-token-usage-xcby BenYuan-Nolove-onani
Token usage statistics plugin for DeepSeek Harness — per-window consumption metrics with an enable/disable switch, right in Settings.----------DeepSeek Harness 的 Token 用量统计插件:按时间窗统计消耗指标,设置页内随时启停。
★ 0
↓ 89/wk
MIT
JavaScript
Aug 15, 2026
dsh plugin --profile web add dsh-token-statsby yokesky
DeepSeek Harness (DSH) 用量统计面板 — usage statistics dashboard: GitHub-style heatmap, daily token trend, model usage donut.
★ 3
↓ 179/wk
MIT
TypeScript
Aug 15, 2026
dsh plugin --profile web add @yokesky/dsh-usage-lensby Hjay1101
GitHub-style token usage heat map for DeepSeek Harness — day/week/month granularity, per-model breakdown, hover-today badge. Read-only, fully local.
★ 1
MIT
JavaScript
Oct 23, 2026
dsh plugin --profile web add dsh-plugin-token-usageby LeemanCheung
Persistent token usage records and dashboard for DeepSeek Harness
★ 12
↓ 208/wk
MIT
TypeScript
Sep 27, 2026
dsh plugin --profile web add dsh-token-usage