

dsh-client-ui-trace-graph
Manifest valid★ 2DSH Web GUI plugin: interactive ReactFlow DAG for the official trajectory ledger — sequence + structure edges, dagre/force layouts.
@tieveto666-code/dsh-client-ui-trace-graph
English | 中文



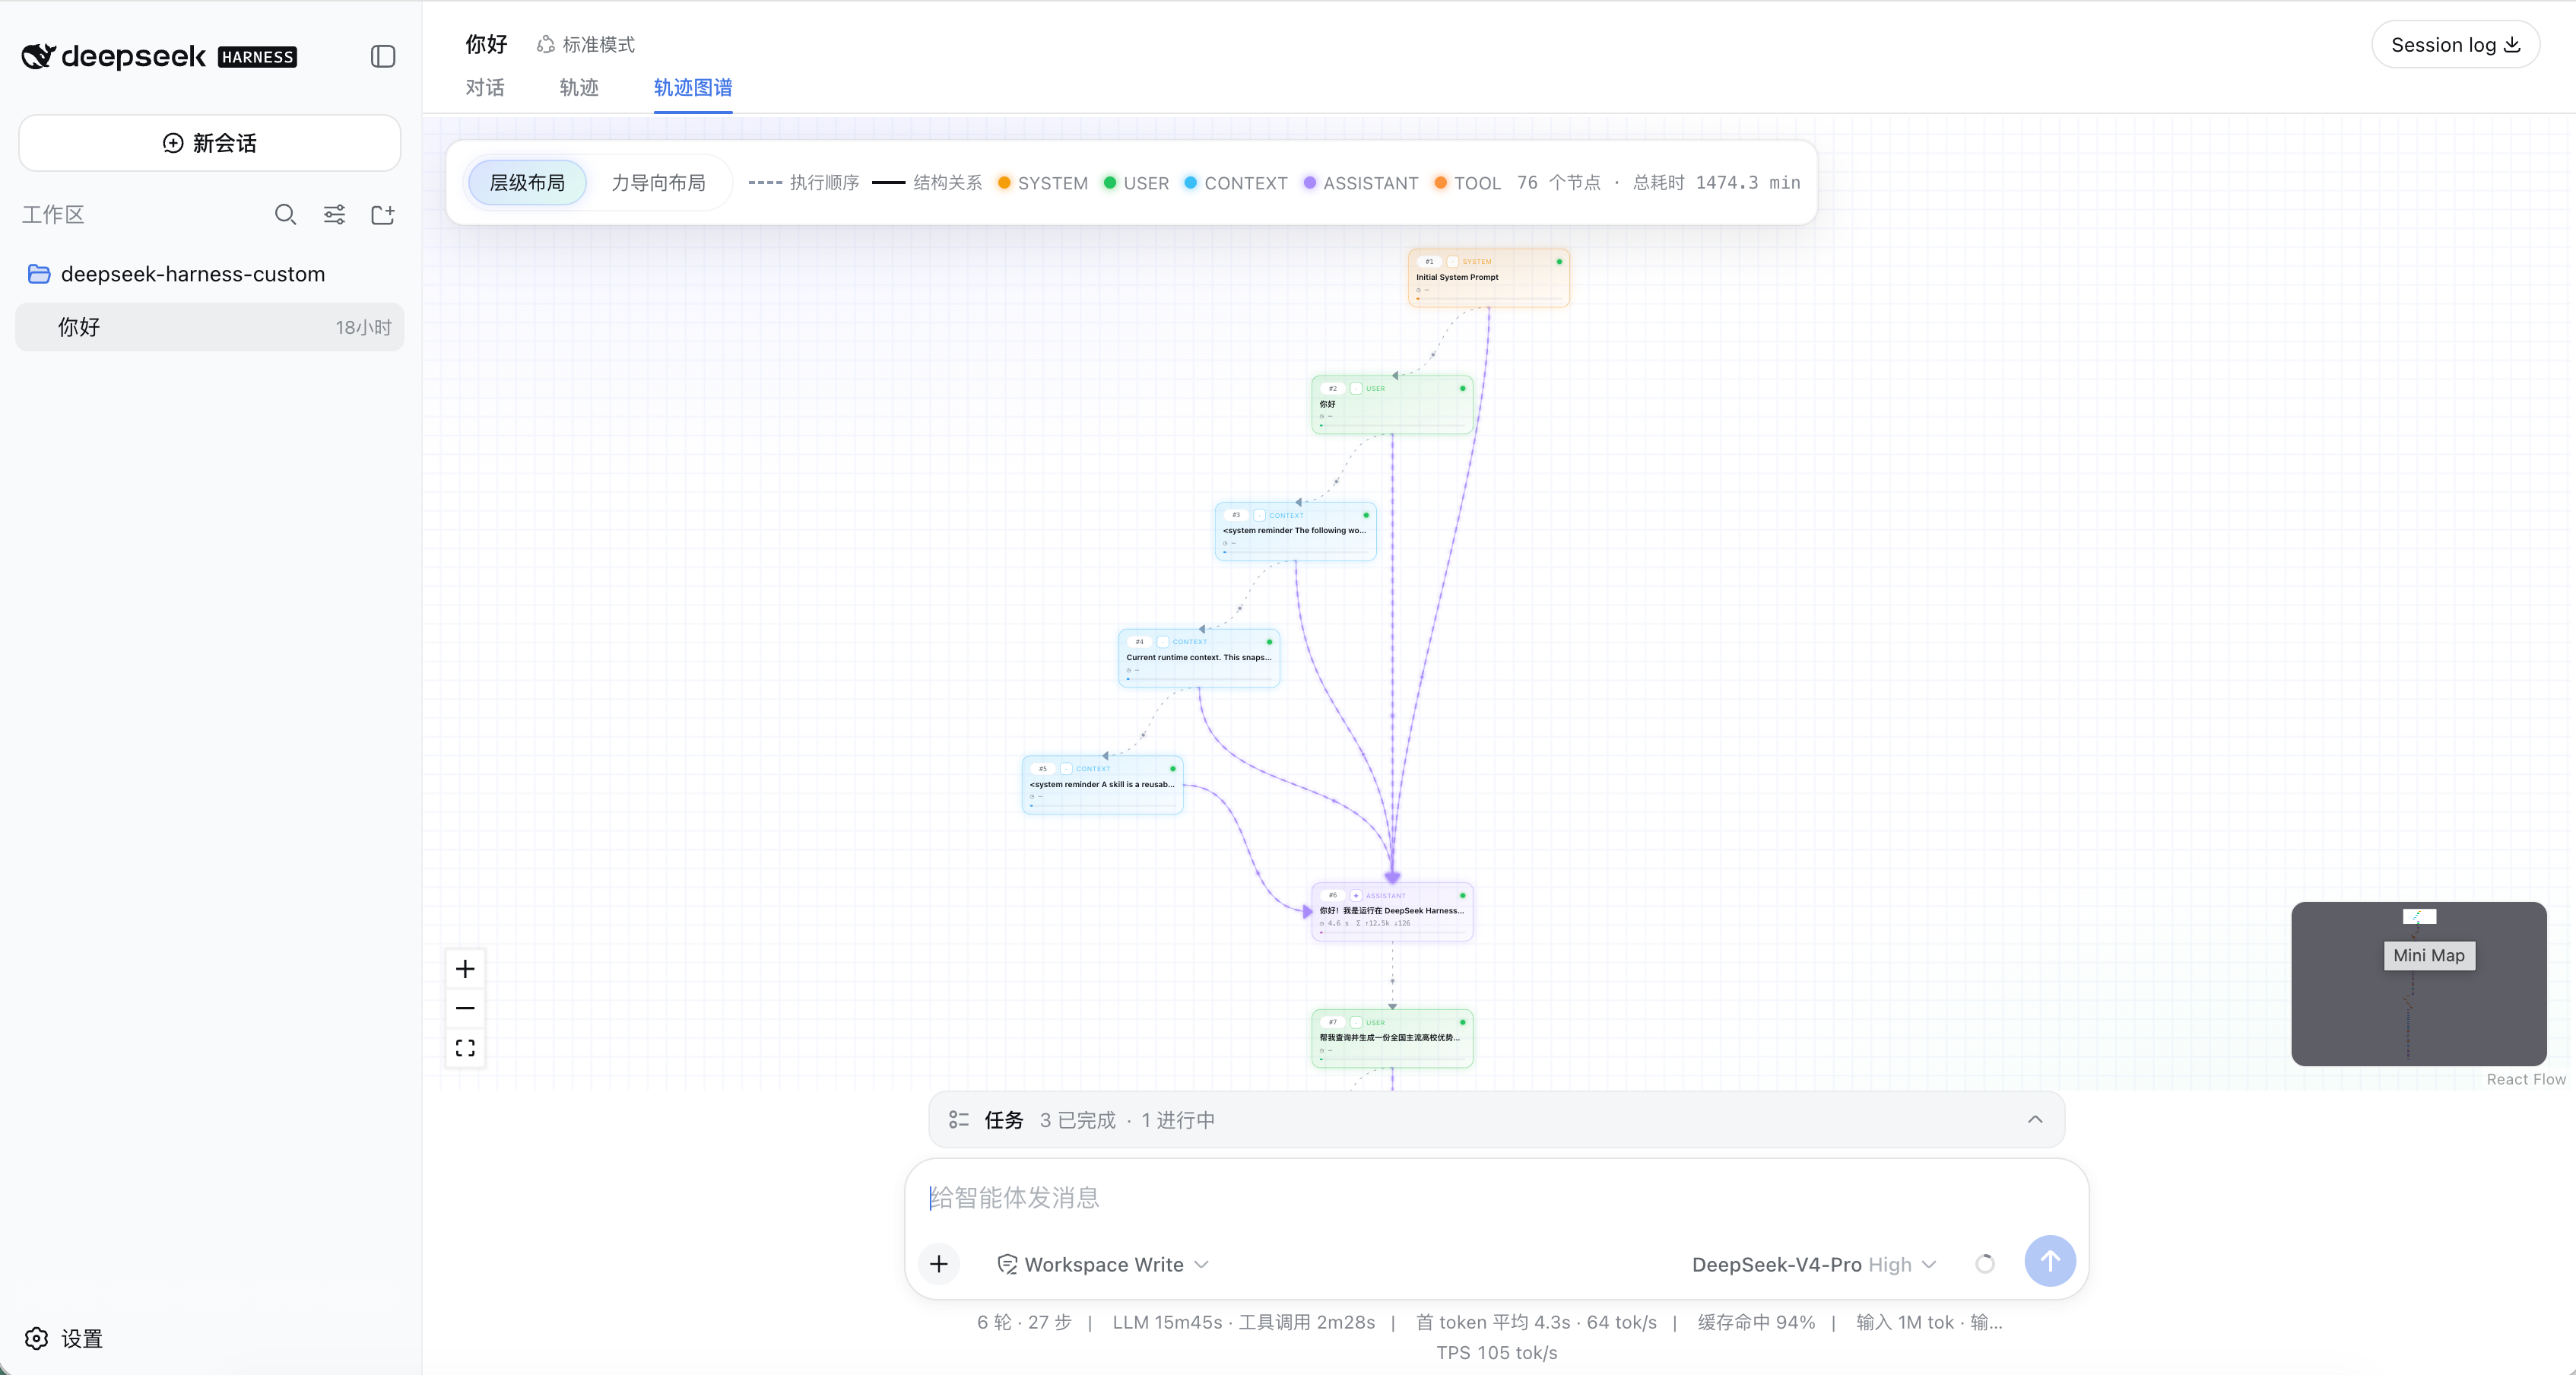
Turn the official DSH Web GUI trajectory ledger into an interactive DAG: the same live records as the built-in「轨迹」tab, rendered as a ReactFlow graph so you can see execution order and proven structure at a glance.
Why this plugin
Official「轨迹」is a powerful inspection table. This plugin keeps that same source of truth and adds a spatial reading of the run:
- Same data, no second ledger — reads
snapshot.views.get('trajectory')(plus safe fallbacks). What you see in the graph is what the session already recorded, not a mock or a parallel log. - Two edge kinds you can trust — gray sequence edges always show what happened next; colored structure edges appear only when row fields prove a causal / nesting link. No invented arrows.
- Debug the agent loop visually — SYSTEM / USER / CONTEXT / ASSISTANT / TOOL / SUBTOOL / COMPACTION as typed nodes, with summary, sequence #, latency, status, and token usage; click a node for Input / Output JSON.
- Fits the official shell — mounts as a first-party conversation view tab (not a modal or center-column takeover); chrome colors follow
--dsw-*themes and skins. - Layouts for different questions — dagre hierarchy (default) for causal depth; d3-force for an organic overview; switch anytime from the toolbar.
How to read the graph
| Visual | Meaning |
|---|---|
Gray dashed edge (sequence) | Chronological execution order. Always drawn between adjacent trajectory records: A happened, then B. Legend: 「执行顺序 / Sequence」. |
Colored solid edge (structure) | Proven structure / causality (semantic color by target label). Emitted only when fields prove a link — e.g. prompt/context → next assistant, assistant → tool call, tool/subtool nesting, tool result consumed by a later assistant. Legend: 「结构关系 / Structure」. |
| Node label | Real trajectory label (SYSTEM, USER, CONTEXT, ASSISTANT, TOOL, …). |
| Node body | Real summary, sequence number, latency, status, token usage. |
| Detail panel | Click a node to inspect recorded Input / Output JSON. |
Reading tip: gray only = order is known, stronger relationship is not proven; gray + color = order plus a verified upstream/downstream link.
Features
- Conversation tab 「轨迹图谱 / Trace Graph」 beside official views.
- Hover highlighting of upstream / downstream neighbors.
- Toolbar layout toggle: dagre / d3-force; ResizeObserver re-fits when the view or sidebar resizes.
- Settings card (Settings → Plugins):
enabled,announceToAgent,defaultLayout. - Optional host announcement so agents know the plugin is installed.
Requirements
- Node.js
^22.19 || >=24 - pnpm 11
- A working
dsh webinstall (official@deepseek-ai/dshSDK)
Install
From GitHub (after you publish this repository)
dsh plugin --profile web add github:tieveto666-code/dsh-client-ui-trace-graph
pnpm ≥10 may block the package prepare script on first install. If dsh tells you to allow builds, add the printed package key to that profile's pnpm-workspace.yaml under allowBuilds, then run add again.
From a local checkout (development)
git clone https://github.com/tieveto666-code/dsh-client-ui-trace-graph.git
cd dsh-client-ui-trace-graph
pnpm install
pnpm build
dsh plugin --profile web add link:$(pwd)
Restart dsh web and refresh the page; the Trace Graph tab appears beside the conversation tabs.
Develop
pnpm install
pnpm typecheck
pnpm test
pnpm build
After upgrading @xyflow/react, regenerate the scoped ReactFlow stylesheet:
pnpm gen:reactflow-css
Data model
The browser adapter projects each live trajectory row into a TraceSpan, preserving label, summary, source seq, turn, step, status, timing, and Input/Output references. Every pair of adjacent records gets a sequence edge; structure edges are added only for relationships proven by row fields (see How to read the graph).
Known limitations
- Structure edges are conservative: when the trajectory data does not prove a relationship, the graph keeps only the chronological sequence edge.
- ReactFlow keeps its attribution mark in the corner unless a Pro license is used; it is intentionally not hidden.
- Large graphs reduce the per-edge particle count automatically; with hundreds of nodes, consider disabling
backdrop-filteron nodes.
License
MIT © Changsheng Tie (tieveto666-code)
Comments
Loading…
From the same category
by deepseek-ai
DeepSeek Harness: Everything is a Plugin.
★ 232.4k
MIT
TypeScript
Sep 17, 2026
by nexu-io
🎨 Best DeepSeek Harness Design Plugin. The open-source Claude Design alternative. 🖥️ Local-first desktop app. 🖼️ Your coding agent becomes the design engine: prototypes, landing pages, dashboards,
★ 97.5k
Apache-2.0
TypeScript
Sep 22, 2026
by Tencent
Open-source LLM knowledge platform: turn raw documents into a queryable RAG, an autonomous reasoning agent, and a self-maintaining Wiki.
★ 28.5k
↓ 831/wk
NOASSERTION
Go
Sep 21, 2026
dsh plugin --profile web add @wxg-prc-cpg/dsh-weknoraby awesome-dsh-plugin
A curated list of plugins for DeepSeek Harness (dsh) · DeepSeek Harness 插件精选列表
★ 16.5k
CC0-1.0
Python
Sep 22, 2026
by zhu1090093659
DeepSeek Harness (DSH) Web Plugin Aggregation Ecosystem · Everything is a plugin, distributed via the Creative Workshop
★ 7.9k
Apache-2.0
TypeScript
Sep 21, 2026
dsh plugin --profile web add dsh-webby yjh051108
dsh-routing-suite — injector + router-standard kit: install the runtime injector first, then the task-aware reasoning-mode router preset (measured P1-P23).
★ 7.2k
MIT
JavaScript
Sep 18, 2026
dsh plugin --profile web add @dsh-external/dsh-super-injector