

dsh-api-usage-dashboard
Identified★ 2Zero-config API usage dashboard for DeepSeek Harness (DSH): 24h token chart, per-day drill-down, per-provider/model colors, aggregated from local session logs.






🇨🇳 中文
装完就有数据,不用配任何东西
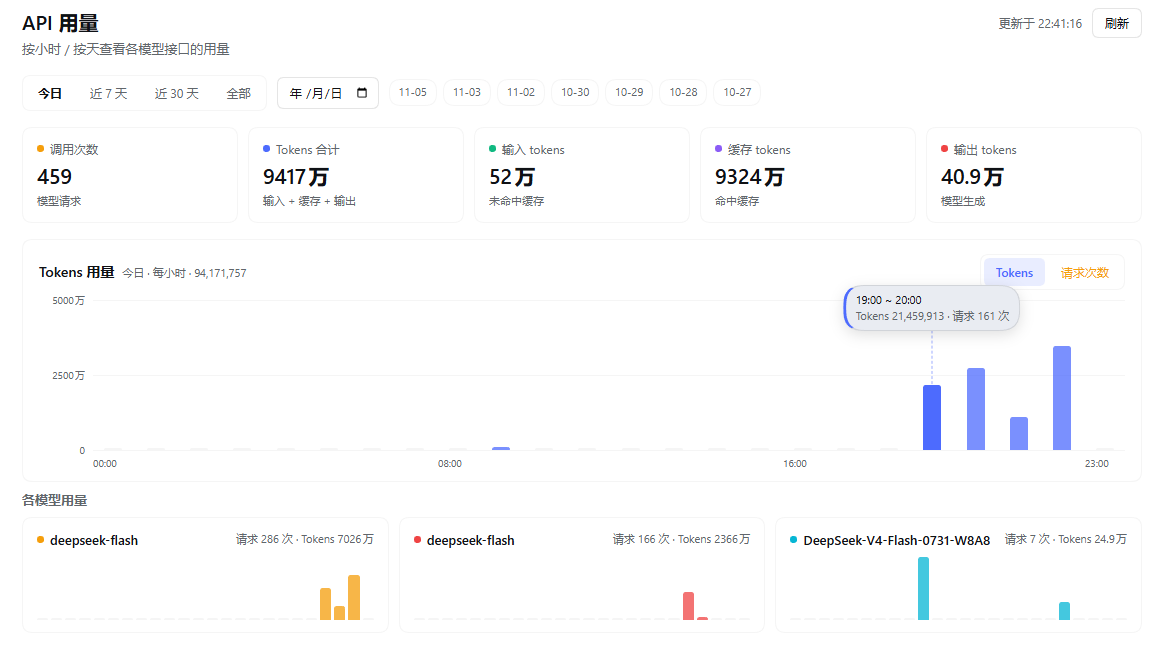
这是一个 DeepSeek Harness(DSH)插件。装上之后,左侧边栏多一个图标,点开就是你的模型 API 用量仪表盘——每个 provider、每个模型、每个小时,调用了多少次、烧了多少 token。
不需要填接口地址,不需要贴 API key,不需要另接 Prometheus / Langfuse。 插件直接读 Harness 自己的会话记录,你以后新接任何一家模型,第一次调用就会自动出现在图里。
为什么是它
| 常见做法 | 痛点 | 这个插件 |
|---|---|---|
| 登录各家控制台看账单 | 要一个个平台切,且只能看到总额 | 一个面板汇总所有 provider |
| 接 Langfuse / Helicone 等平台 | 要改代码、要出网、有延迟 | 零侵入,装完即用 |
| 自己写脚本解析日志 | 要维护、没界面、不能下钻 | 现成的 24 小时图 + 按天钻取 |
你的数据一步都不出门:没有外部请求、不读取 API key、只在本机开一个 loopback 路由。
功能
- 🕐 24 小时柱状图:固定 00:00–23:00 全刻度,没调用的时段留空槽,图形不会因为"一天只有几小时"而失真
- 📅 按天钻取:日期选择器 + 最近 7 天快捷标签,随时回看某一天的小时分布
- 🖱️ 完全可交互:悬停出虚线定位线 + 气泡(时间段 / tokens / 请求数),点击可钉住柱子对照
- 🔀 Tokens / 请求次数 一键切换,Y 轴自动取整(1/2/5×10ⁿ)+ 网格线
- 🎨 彩色系列:Tokens 蓝 / 请求 琥珀;每个 provider、每个模型各有固定颜色,颜色贯穿卡片、迷你图、明细表
- 📊 按模型分组:每个模型一张 24 小时迷你柱图,看谁在烧 token 一目了然
- 🧾 明细表:provider 汇总 + 模型明细,调用 / 输入 / 缓存 / 输出 / 合计 / 占比一目了然
- 🌗 跟随宿主主题、中英双语、60 秒自动刷新
三步装上
- 在 DSH 的插件管理器里选 install_bundle
- 输入包名
dsh-api-usage-dashboard(已发布到 npm),也可以指向本地目录 - 侧边栏点柱状图图标 → 完成
首次打开会扫一遍全部会话日志(23 个会话约 1–2 秒),之后走缓存,基本秒开。
不想用 npm 也行:把仓库拷到本地用目录路径安装,或者直接填 git 地址
github:LENS-Views/dsh-api-usage-dashboard(本仓库 public,无需构建步骤)。
统计口径
| 指标 | 含义 |
|---|---|
| 调用次数 | 会话里记录的模型调用条数(含压缩摘要等非对话调用) |
| 输入 tokens | 未命中缓存的输入(inputTokens) |
| 缓存 tokens | 命中提示缓存的输入(cacheReadTokens) |
| 输出 tokens | 模型生成(outputTokens) |
| 合计 tokens | totalTokens = 输入 + 缓存 + 输出 |
同一 provider 下按模型分行;不同 provider 即使模型同名也分开统计。
隐私边界
- 只读本机
~/.dsh/sessions下的会话日志 - 不读取、不转发任何 API key
- 不向任何外部服务发请求
- 只注册一个
127.0.0.1路由,非本机请求直接 403
配置
cordis.patch.yml 的 config 可调,全部有默认值,不改也能用:
- insert:
    - id: api-usage-dashboard
      name: 'dsh-api-usage-dashboard'
      config:
        cacheTtlMs: 20000    # 扫描结果缓存(毫秒),0 = 每次重扫
        maxSessions: 0       # 只扫最近 N 个会话,0 = 全部
        scanConcurrency: 4   # 并发读取会话数(1–8)
常见问题
金额(¥)呢? 还没做。需要每个 provider 的单价,而自建网关通常不公开牌价;有单价就能加。
能统计不经过 Harness 的请求吗? 不能。它统计的是 Harness 实际发出的模型调用——这也正是"不会算错"的原因。
会拖慢 DSH 吗? 不会。扫描在宿主进程里做、结果按 20 秒缓存,界面每 60 秒取一次。
目录与维护脚本
index.js              宿主:用量聚合 + loopback 路由
client.js             浏览器:面板、图表、双语文案
cordis.patch.yml      Loader 行
locale/{zh,en}.json   插件管理器里的显示名与描述
icon.svg              插件图标
docs/screenshot.png   README 截图
tools/                发版脚本(不随 npm 包发布,files 白名单已排除)
  github-publish.mjs      用 GitHub REST 推送,无需 git 二进制;PNG 等二进制走 blob
  github-login.mjs        OAuth 设备码登录(比 PAT 更安全的取 token 方式)
  npm-publish-http.mjs    纯 Node 打 tar.gz 并直接 PUT 到 registry,支持 --otp
凭据统一放在仓库同级的 .secrets/(github-token、npm-token),脚本自动读取,也可用 GITHUB_TOKEN_FILE / NPM_TOKEN 覆盖;.secrets/、.npm-out/ 已写进 .gitignore。
改宿主代码后,用插件管理器把 api-usage-dashboard 这一行关一次再开,即可热重载;改浏览器代码刷新页面。
作者
- LENS-Views — 项目发起、需求与验收、发布
- DSH Agent(deepseek-flash) — 实现:宿主侧用量聚合、面板与图表、发布脚本与文档
本项目在 DeepSeek Harness 的会话里由人类与 AI agent 结对完成:设计与验收归人类,代码与文档由 agent 起草。这也是它存在的原因——想要一个"装完就看见"的用量面板,于是直接在这个 harness 里把它写出来了。
关于署名方式:AI 协作者以纯文本署名。它没有自己的 GitHub 账号与邮箱(不会借用 DeepSeek 或任何第三方账号,以免被误认为官方身份),因此不会出现在 contributors 图和
@提及里——这是刻意为之,不是遗漏。若将来 DeepSeek 为它提供官方账号,这里的署名与提交 trailer 会同步更新。
许可证
🇬🇧 English
Install it, and the data is already there
A DeepSeek Harness (DSH) plugin that adds a model API usage dashboard to the sidebar: requests and tokens per provider, per model, per hour.
No endpoint to configure, no API key to paste, no extra collector to run. It reads Harness's own session records, so any provider you add later shows up automatically on its first call.
Why this one
- One panel for every provider instead of switching between vendor consoles that only show a grand total
- Zero integration — no SDK changes, no egress, no agent to deploy, unlike hosted observability platforms
- Durable by construction — it reads the session log, the same source Harness replays from, instead of keeping a parallel counter that can drift
Nothing leaves your machine: no outbound requests, no API keys read, one loopback-only route.
Features
- 🕐 Full 24-hour axis (00:00–23:00), empty hours kept as slots so the shape never lies
- 📅 Per-day drill-down: date picker plus the last seven days as quick chips
- 🖱️ Interactive bars: hover for a guide line and a tooltip (time range / tokens / calls), click to pin one for comparison
- 🔀 Tokens ⇄ Requests switch, auto-rounded Y axis (1/2/5×10ⁿ) with gridlines
- 🎨 Color-coded series: blue for tokens, amber for requests; a stable hue per provider and per model, reused across cards, mini charts and the table
- 📊 Per-model mini charts so the heavy hitters are obvious at a glance
- 🧾 Breakdown table: calls, input, cached, output, total and share per provider and model
- 🌗 Host theme aware, bilingual, refreshes every 60 seconds
Quick start
# inside DeepSeek Harness: plugin manager → install_bundle
dsh-api-usage-dashboard
- Open DSH's plugin manager and choose install_bundle
- Enter the package name
dsh-api-usage-dashboard(published on npm), or point it at a local folder - Click the bar-chart icon in the sidebar
The first open scans every session log (about 1–2 s for 23 sessions), then serves from cache.
No npm needed: install the folder directly, or point
install_bundleatgithub:LENS-Views/dsh-api-usage-dashboard(public repo, no build step).
What is counted
| Metric | Meaning |
|---|---|
| Requests | Recorded model calls, including compaction and other non-chat calls |
| Input tokens | Prompt tokens not served from cache (inputTokens) |
| Cached tokens | Prompt tokens served from cache (cacheReadTokens) |
| Output tokens | Tokens generated by the model (outputTokens) |
| Total tokens | totalTokens = input + cached + output |
Models are listed under their provider; the same model name under two providers stays two rows.
Privacy
- Reads only local session logs under
~/.dsh/sessions - Never reads or forwards an API key
- Makes no outbound request
- Registers a single
127.0.0.1route; non-loopback callers get 403
Configuration
Every field has a default:
- insert:
    - id: api-usage-dashboard
      name: 'dsh-api-usage-dashboard'
      config:
        cacheTtlMs: 20000
        maxSessions: 0
        scanConcurrency: 4
FAQ
Where is the money column? Not implemented: it needs a unit price per provider, and self-hosted gateways rarely publish one. Give it prices and it can be added.
Does it see traffic that bypasses Harness? No — it counts the calls Harness actually made, which is also why the numbers stay honest.
Does it slow DSH down? No. Scanning happens in the host process and its result is cached for 20 seconds.
Layout and release tooling
index.js              host: usage aggregation + loopback route
client.js             browser: panel, charts, bilingual copy
cordis.patch.yml      loader row
locale/{zh,en}.json   display name and description in the plugin manager
icon.svg              plugin icon
docs/screenshot.png   README screenshot
tools/                release scripts (excluded from the npm package by `files`)
  github-publish.mjs      pushes through the GitHub REST API, no git binary; binaries go via blobs
  github-login.mjs        OAuth device-flow login (safer than pasting a PAT)
  npm-publish-http.mjs    packs with plain Node and PUTs to the registry, supports --otp
Credentials live in .secrets/ next to the repo (github-token, npm-token); the scripts pick them up automatically and both GITHUB_TOKEN_FILE and NPM_TOKEN override the paths. .secrets/ and .npm-out/ are gitignored.
After changing host code, toggle the api-usage-dashboard row off and on to hot-reload it; for browser code, refresh the page.
Authors
- LENS-Views — project initiator, requirements, review, release
- DSH Agent (deepseek-flash) — implementation: host-side aggregation, panel and charts, publish tooling, documentation
The project was built in a DeepSeek Harness session, pairing a human with an AI agent: the human owns the design decisions and acceptance, the agent drafts the code and docs. That is also why it exists — the fastest way to get a zero-config usage panel was to write one from inside the harness.
On attribution: the AI collaborator is credited in plain text. It has no GitHub account or email of its own (none is borrowed from DeepSeek or any third party, so nothing here suggests an official identity), which is why it does not appear in the contributors graph or in
@mentions — intentional, not an oversight. If DeepSeek ever issues it an official account, this credit and the commit trailers will be updated.
License
Comments
Loading…
From the same category
by awesome-dsh-plugin
A curated list of plugins for DeepSeek Harness (dsh) · DeepSeek Harness 插件精选列表
★ 22.8k
CC0-1.0
Python
Nov 5, 2026
by 0xsline
DeepSeek Harness (DSH) ecosystem: curated plugins, tools, and infrastructure from dsh-external/hub and the public dsh-plugin topic.
★ 1.3k
CC0-1.0
Python
Oct 16, 2026
by uumit-ai
Open dsh web from your phone or another computer through a UUMit account, without running your own server or installing another program: a built-in tunnel client connects to UUMit's hosted tunnel, and
★ 494
↓ 268/wk
MIT
JavaScript
Oct 21, 2026
dsh plugin --profile web add @uumit-ai/dsh-uumit-remoteby Yuuyuko-uu
DSH 鱼的记忆:给会话一份会淡忘的长期记忆,每条都带时间
★ 483
MIT
JavaScript
Nov 4, 2026
dsh plugin --profile web add dsh-fish-memoryby SAOS-3624
Scene-aware storyboard for DeepSeek Harness: 9-16 numbered cells with timestamps + transcript + an audio envelope, packed into ONE image (384 tokens). Two tools: video_storyboard and video_zoom.
★ 443
↓ 17k/wk
MIT
JavaScript
Nov 5, 2026
dsh plugin --profile web add dsh-video-storyboardby xiajiajun516
DeepSeek Harness (DSH) backup & restore plugin — export, import, migrate and sync your complete DSH configuration, plugins, MCP servers, skills and workspace. One-click migration to another machine.
★ 301
↓ 8.3k/wk
MIT
TypeScript
Nov 4, 2026
dsh plugin --profile web add dsh-config-manager