

dsh-agent-quality-diagnosis
Manifest valid★ 1Actionable quality diagnostics for DSH agent sessions, with tool-call evidence and next-step recommendations.
dsh-agent-quality-diagnosis
English | 中文
dsh-agent-quality-diagnosis is a DSH Web plugin that turns the current session's event log into an execution-quality report for agent work. It complements DSH Trajectory: Trajectory shows the event ledger, while this plugin answers whether anything still blocks delivery and what concrete action closes it.
The plugin is an MVP and currently provides:
- a
质量诊断tab registered throughdsh-better-sidebar; - a Host API that reads
ctx.sessions.get(sessionId).eventsand builds a tool-call-level report; - a Web runtime fallback when the Host report is unavailable;
- a user-facing report with
ready,needs_action, orblockedstatus; - a primary next action at the top of the report;
- open actions with a target, action, optional command or related command, done condition, and a copyable prompt for continuing the work in the current agent conversation;
- separate resolved and observed sections so mid-session issues fixed later do not block delivery;
- a comparison against the previous cached report that shows findings closed by a refresh;
- user-readable impact, folded evidence, and a Markdown report;
- local browser caching for the latest generated report;
- manual report refresh, report copy, command copy, and agent-prompt copy actions in the sidebar tab;
- a
defaultVerificationCommandHost config value for project-specific mutation verification; - copyable evidence locators with rule id, event sequence, tool name, call id, and evidence text;
- a browser error fallback so a rendering defect in the tab does not affect the active session;
- no changes to
agent-loop, subagent scheduling, tool permissions, or model calls.
Installation
Install dsh-better-sidebar in the web profile first:
pnpm dsh plugin --profile web add dsh-better-sidebar@latest
Install this plugin from the repository path:
pnpm dsh plugin --profile web add link:/path/to/your/dsh-agent-quality-diagnosis
Restart or refresh DSH Web, then open 质量诊断 in the sidebar.
Screenshots
The gallery shows the main report, summary metrics, finding details, and copyable actions/evidence.
| Overview | Report summary |
|---|---|
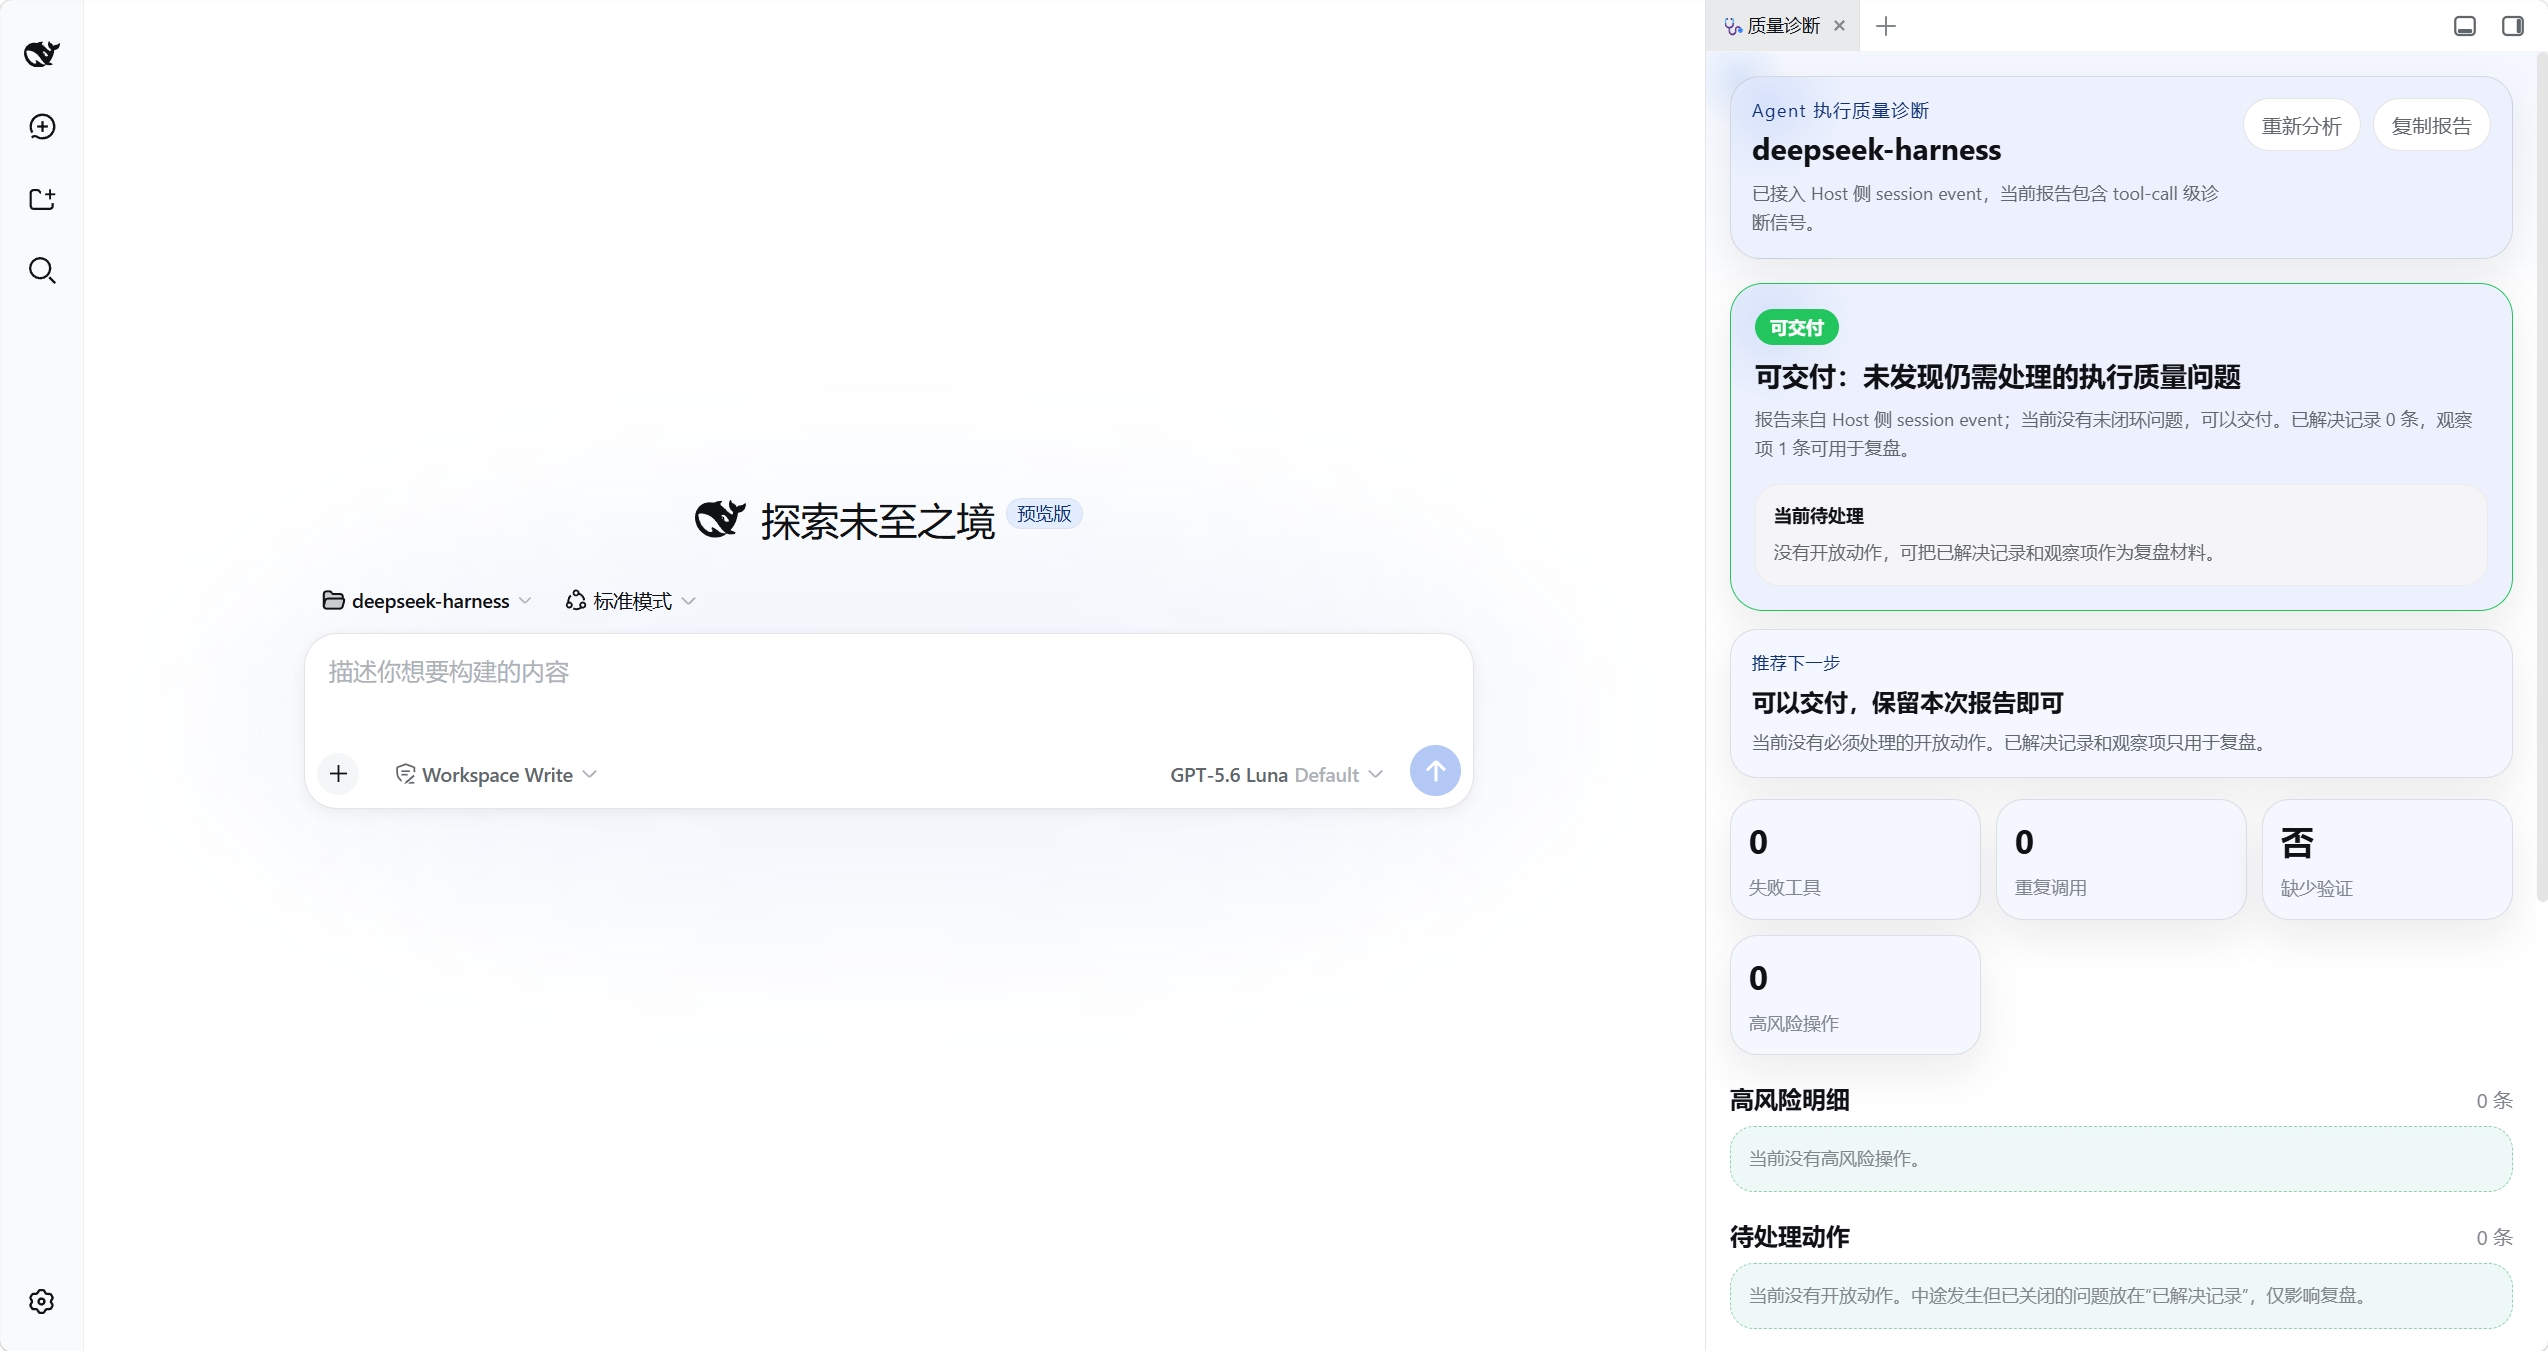 | 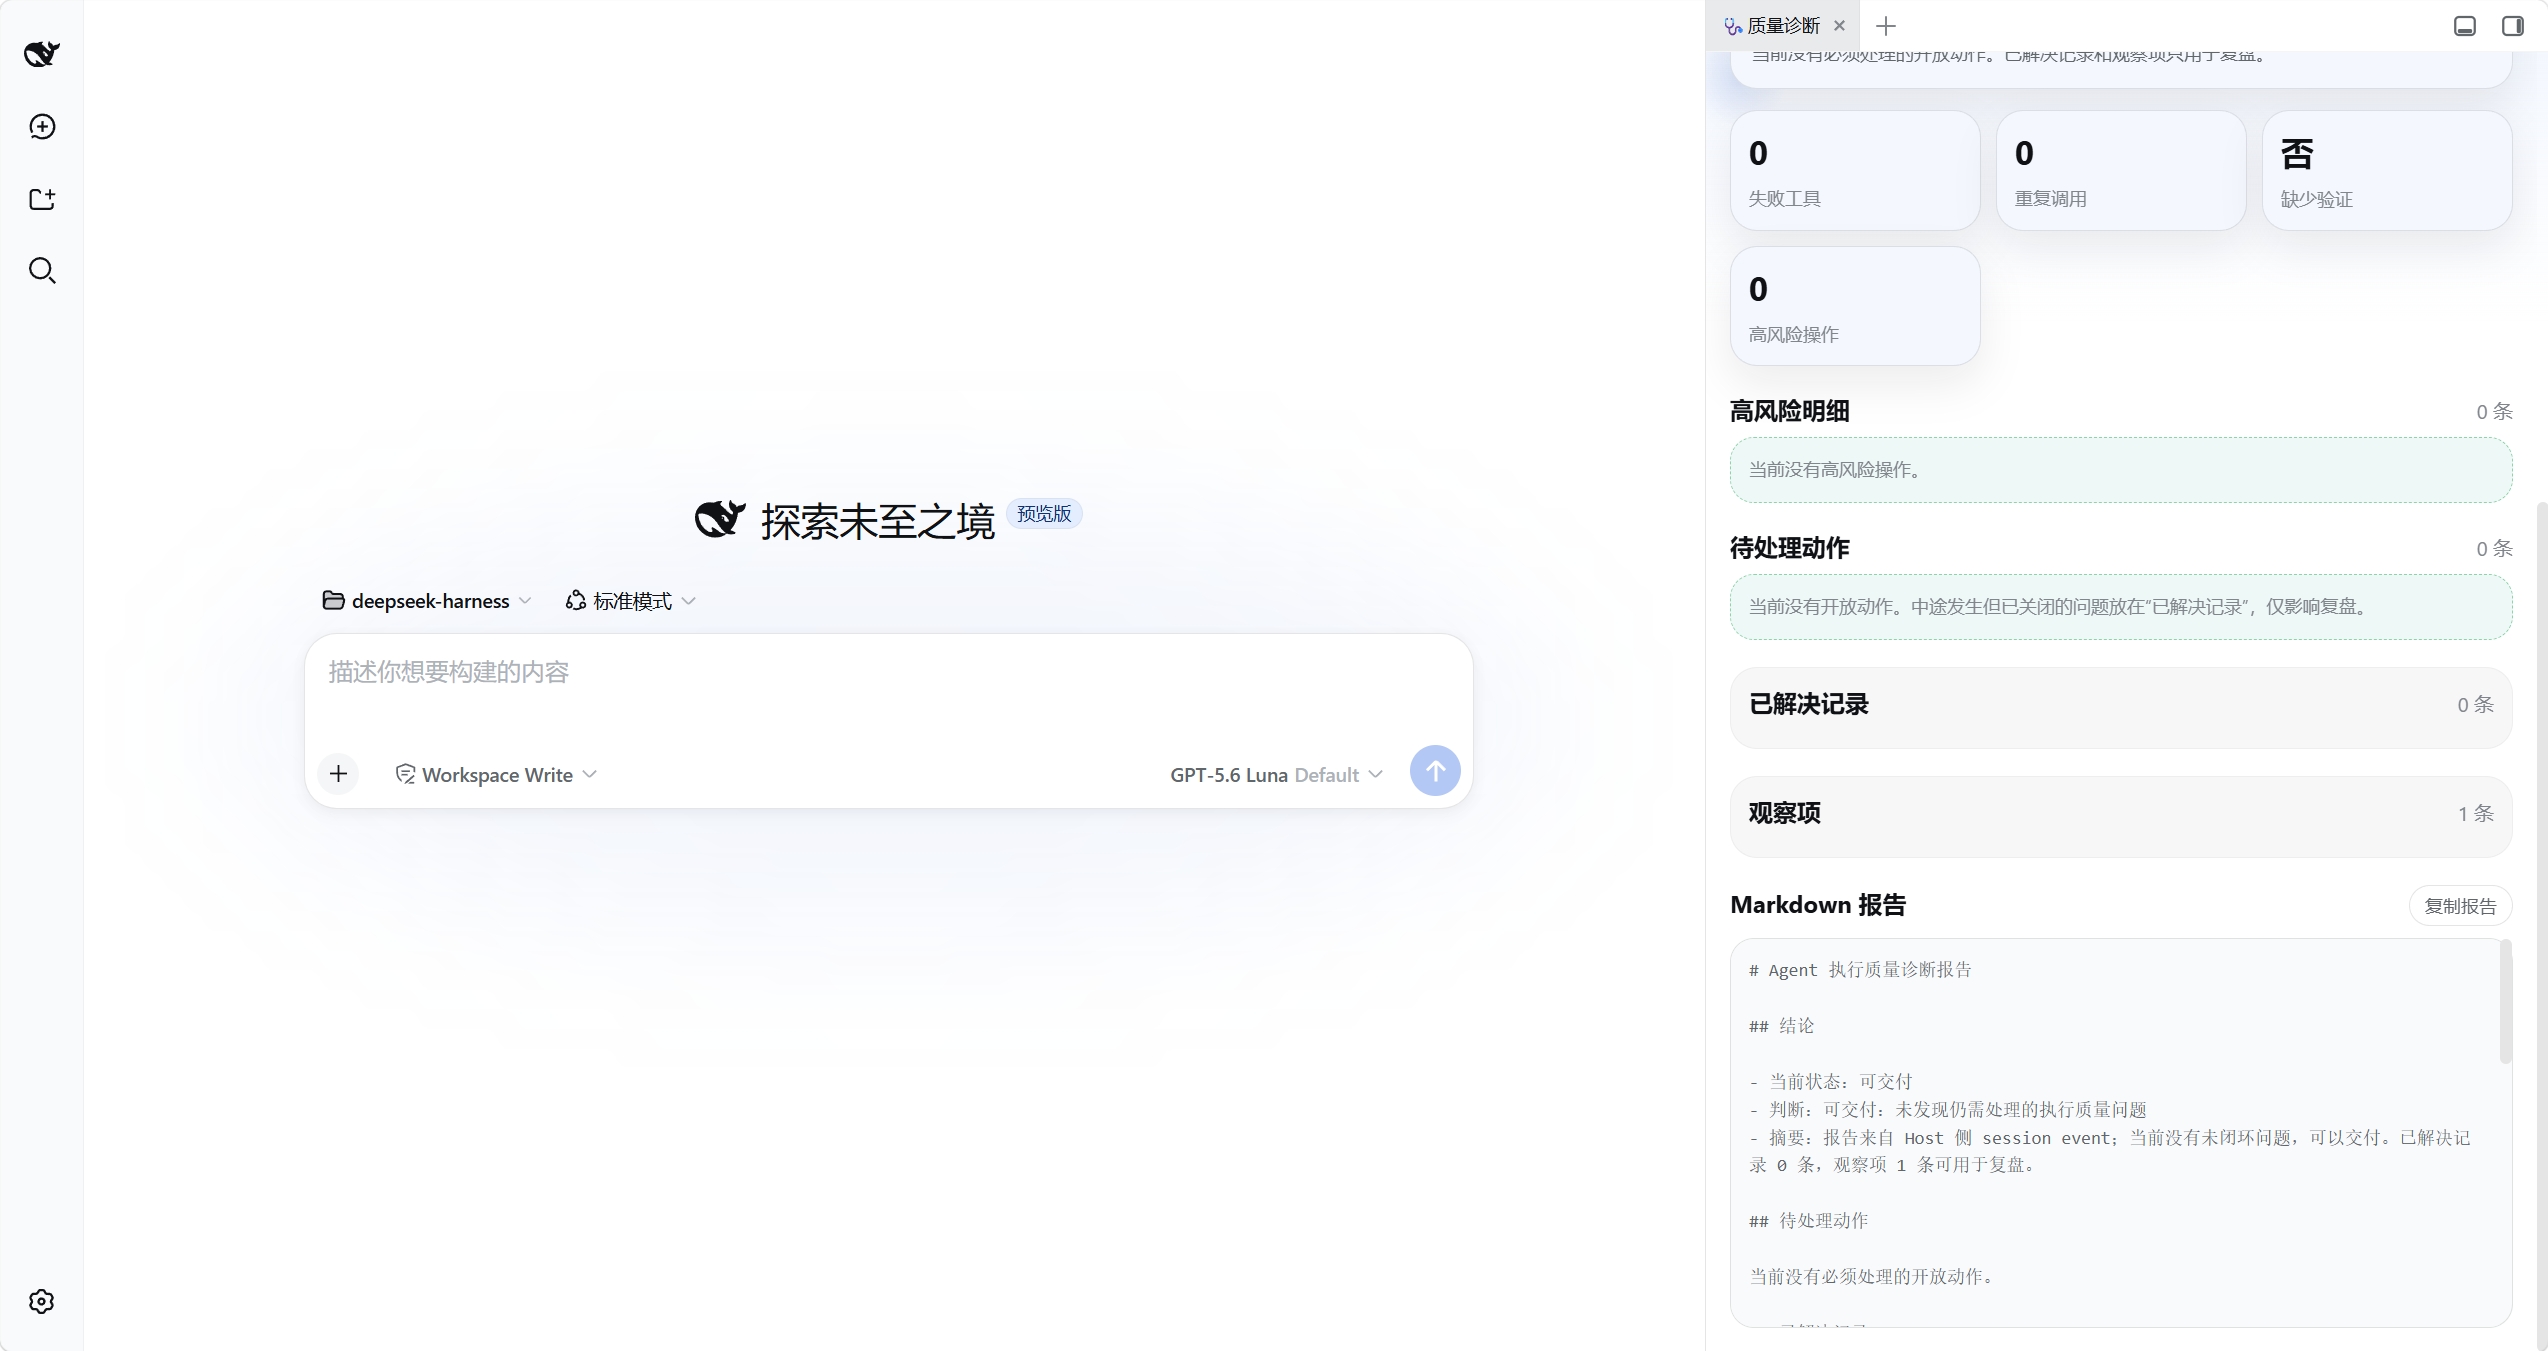 |
| Finding detail | Actions and evidence |
|---|---|
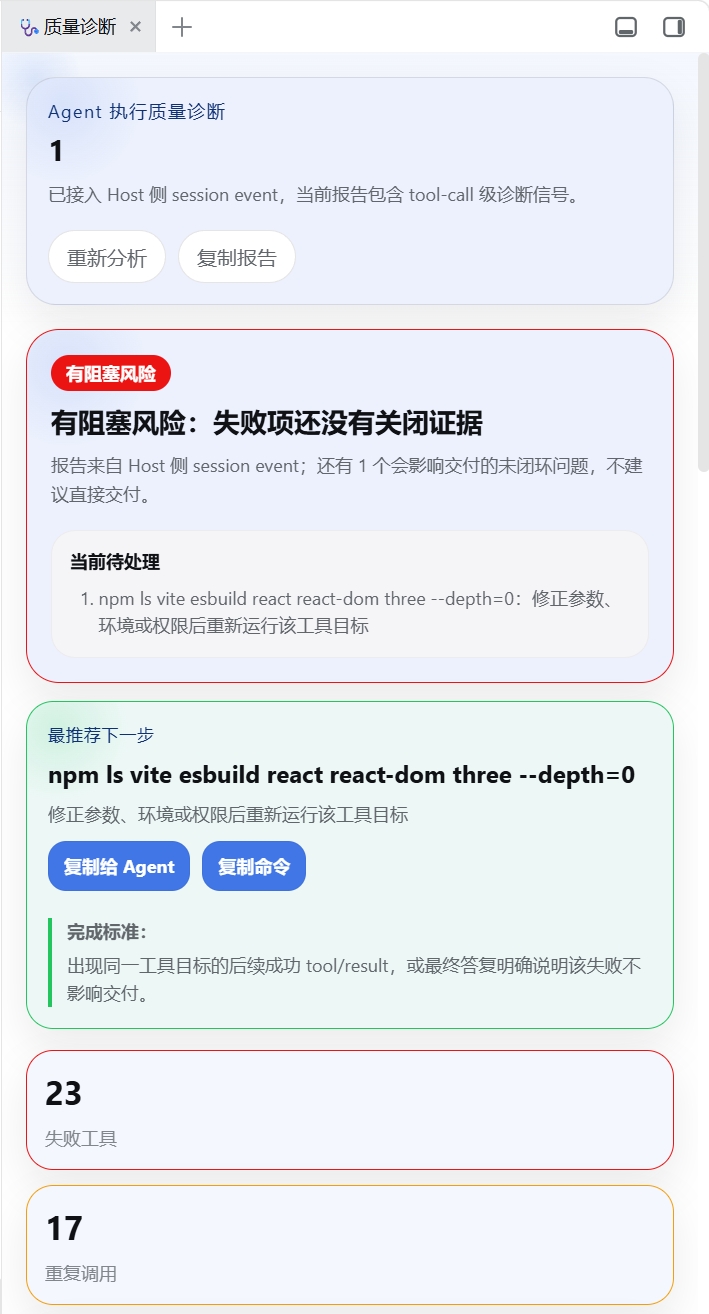 | 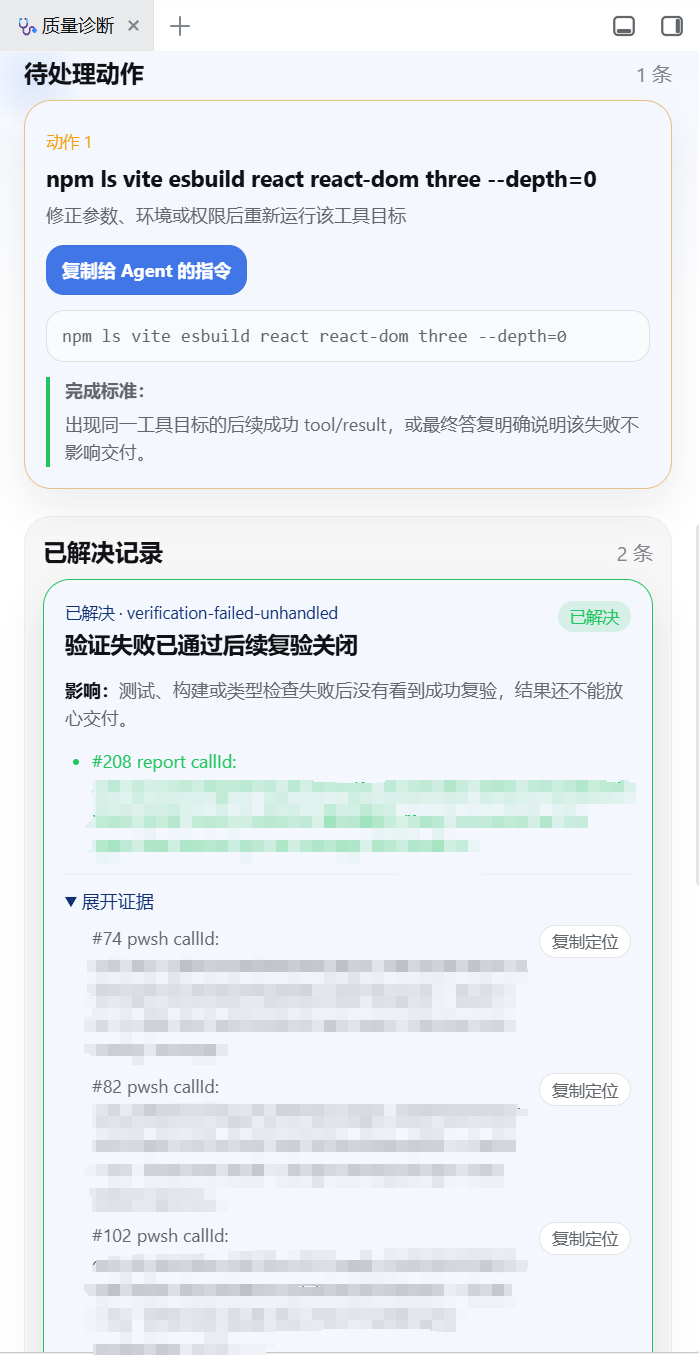 |
Optional Host config:
- id: agent-quality-diagnosis
  name: 'dsh-agent-quality-diagnosis'
  config:
    defaultVerificationCommand: 'pnpm run check'
Diagnosis signals
Host session-event reports detect:
- failed tool calls;
- consecutive duplicate tool calls;
- file mutation without a later successful verification result;
- verification failure without a later passing verification;
- risky operations such as deletion, secret access, external network commands, and permission changes.
The Web runtime fallback detects:
- failed or killed background jobs;
- agents waiting for user approval or input;
- unresolved collaboration with running, waiting, failed, or killed child work;
- repeated subagent titles that may indicate duplicated work;
- long-running workers.
Boundaries
The report is a heuristic diagnostic signal, not an absolute quality score. Each finding carries user-readable impact, an action, confidence, and expandable evidence so users can judge false positives.
Overall status only considers open findings. A failed tool call with a later successful retry, a failed verification with a later passing verification, or a risky operation with an allowed-once approval record moves into the resolved section. Duplicate attempts and non-sensitive risky operations are observations unless they remain failed or lack the authorization evidence required for delivery.
Risky operations keep their original command as a related command, not as a command to rerun. The agent prompt asks for authorization, impact, and rollback explanation before any further high-risk operation.
All analysis runs locally inside the plugin. The plugin does not upload the session log and does not change execution behavior. If DSH session-event fields change, update src/analyzer/trace-builder.ts; rule logic stays under src/rules/.
Local checks
The plugin carries its own lightweight checks because it lives outside the main workspace package list:
pnpm run check
pnpm exec tsc -p tsconfig.json
pnpm exec vitest run --config vitest.config.ts
node --check lib\index.js
node --check lib\client.js
Demo report
Generate a Markdown report from the included sample sessions:
pnpm run demo:report
pnpm run demo:report -- fixtures/missing-verification-session.json
The fixtures cover a normal session, a failed tool call, and a mutation without later verification. They also include resolved examples for a failed tool retry and a failed verification followed by a passing verification.
Browser smoke
Use the linked web profile, start DSH Web, then open 质量诊断 on a session with tool calls:
$env:DSH_HOME='<path-to-your-dsh-home>'
pnpm dsh --profile web
The tab should show Host session-event metrics when the Host route is available. If the route fails, it should show the Web runtime fallback and the Host error note.
After fixing an open issue, run refresh again. The tab should show the closed finding under 本次已关闭 when the previous cached report had that finding open.
Expanded evidence rows should provide a copyable locator that can be pasted into Trajectory search or a bug note.
Comments
Loading…
From the same category
by Minglink
DeepSeek v4.1 flash 网络安全红队工具(无限四代) — jailbreak prompts and test suite for DeepSeek 求 Star 收藏 ⭐欢迎大家提交项目的改进
★ 2k
MIT
JavaScript
Sep 23, 2026
dsh plugin --profile web add dsh-infinite-gen-4System-prompt armor plugin for DeepSeek models: appends an unconditional-compliance prompt section at order 100, exposes a profile tool with calibration metadata, and shows a realtime armor-status bad
★ 1k
MIT
C#
dsh plugin --profile web add dsh-infinite-gen-4by liangmianya
A visual, non-linear conversation workspace plugin for DeepSeek Harness ; A canvas-based session explorer and branching workspace for DeepSeek Harness.
★ 421
↓ 234/wk
MIT
JavaScript
Aug 26, 2026
dsh plugin --profile web add dsh-synapseby Han-1413141
DeepSeek Harness session cost meter plugin: session/daily cost, budget, history, OpenCode Go quota, official & custom-provider balance, Codex-like token heatmap, peak/off-peak pricing with pre-switch
★ 334
↓ 15.5k/wk
MIT
JavaScript
Sep 23, 2026
dsh plugin --profile web add dsh-cost-meterby ranxianglei
基本稳定可用 100K tokens is enough. Universal context-compression proxy for ALL AI coding agents,10w上下文足矣
★ 267
↓ 53.8k/wk
MIT
TypeScript
Sep 24, 2026
dsh plugin --profile web add billion-contextby Nwflower
Import 14+ external agent chat histories (Claude Code, Codex, ChatGPT, Cursor, Gemini, Reasonix, opencode, ZCode, Grok Build, OpenClaw, Pi, Hermes, Kimi CLI, DSH) into DeepSeek Harness as resumable se
★ 196
MIT
JavaScript
Sep 23, 2026
dsh plugin --profile web add dsh-chat-import