

dsh-aw-viz
DiscoveredTurns your own ActivityWatch records into metrics an AI can read — time allocation, fragmentation, focus blocks, hourly rhythm — so the assistant in the same session can suggest concrete changes to ho
dsh-aw-viz


An ActivityWatch habit dashboard for the DeepSeek Harness: one panel with five lenses — time allocation, fragmentation, focus blocks, hourly rhythm, and PC-vs-phone split — computed on your own machine and strictly read-only.
Its job is not to judge your day — it is to make your own usage data readable by an AI.
The plugin turns raw ActivityWatch records into metrics with stated definitions and exposes them
through the aw_habit_report tool, so the assistant in the same session can read the numbers and
propose concrete, personalised changes to how you use your screens. The plugin stays deterministic
and local; the judgement and the suggestions come from the model.
Third-party plugin for the DeepSeek Harness ecosystem — not an official project. Built for Harness 0.2.x desktop (Web frontend).
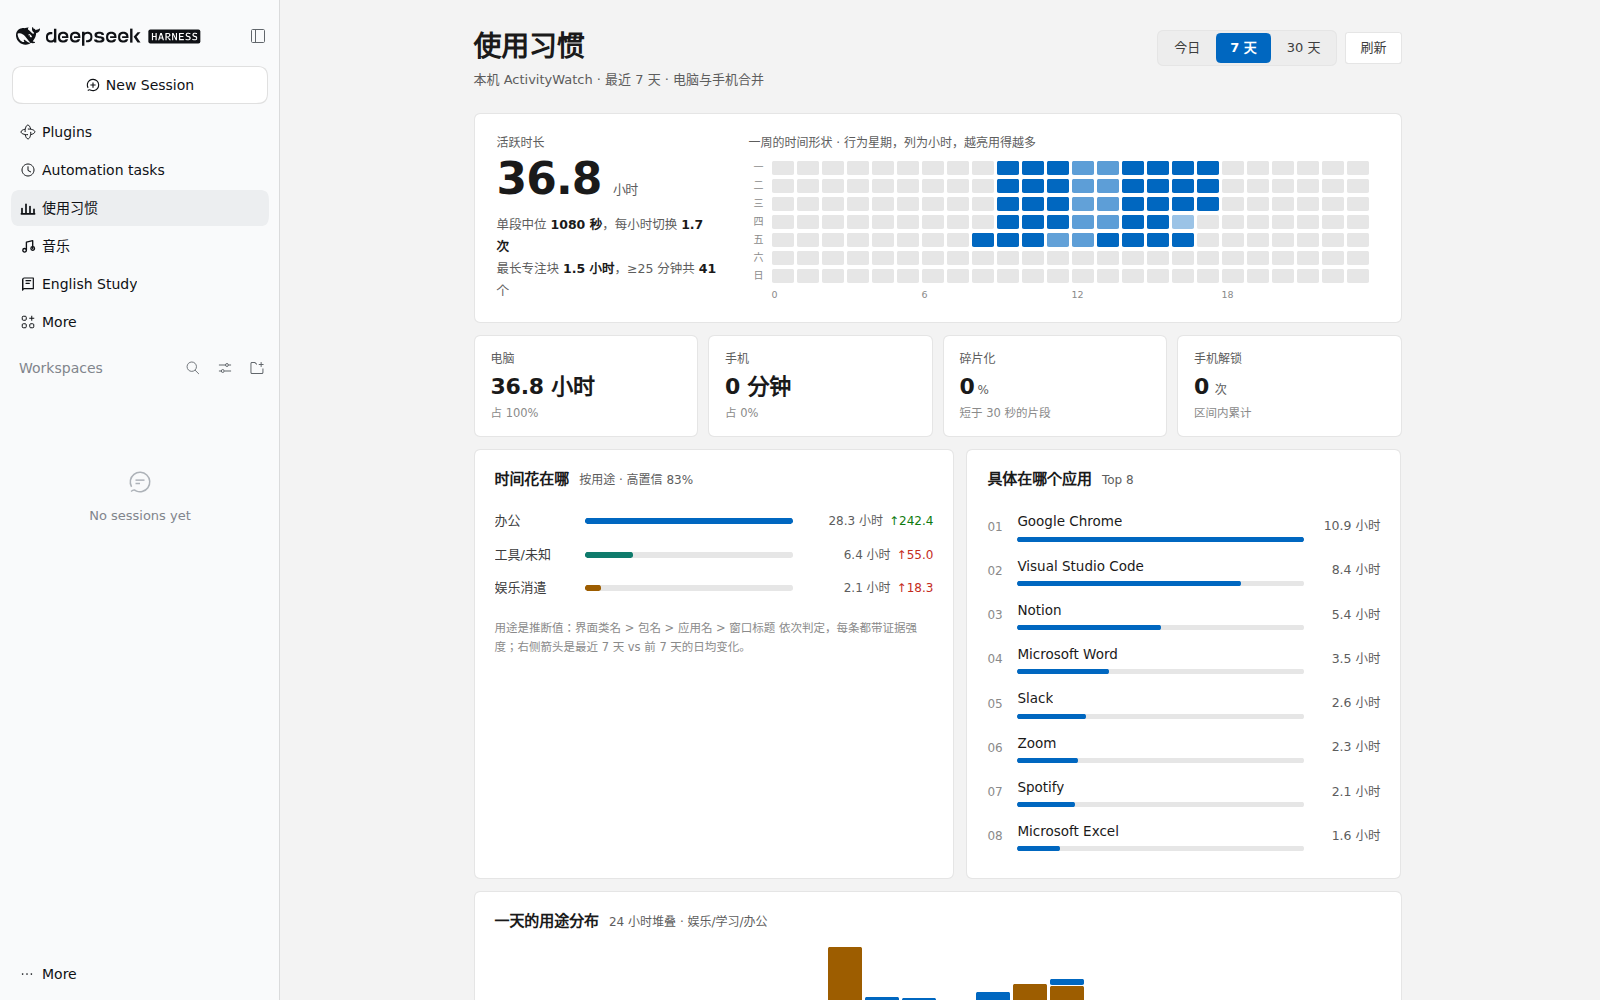 The real panel code rendering a synthetic ActivityWatch stub — no real usage records are included.
Prerequisites
- ActivityWatch must already be installed and running — this panel is a read-only view over it and collects nothing by itself.
- Default endpoint:
http://127.0.0.1:5600(theaw-server/aw-server-rustREST API). Point it elsewhere with theactivityWatchBaseconfig option. - If ActivityWatch is not running the panel does not break:
/api/healthanswers200with{"ok": false, "error": "fetch failed"}and the summary route returns500, so the UI shows an empty state instead of inventing numbers. - Verified in a clean headless environment: with ActivityWatch running, every route answers
200and the model tool returns real aggregates.
What it measures
Each metric below has an external reference, so the numbers are not home-made heuristics.
| Dimension | Metrics | Grounding |
|---|---|---|
| Time allocation | Share by category, top apps, PC vs phone split | RescueTime's productivity-pulse / category-share convention |
| Fragmentation | Median segment length, switches per active hour, share of segments < 30 s | Mark et al. 2008, The Cost of Interrupted Work; Leroy 2009, attention residue |
| Focus | Longest uninterrupted same-category block, count of blocks ≥ 25 min | Deep Work (Newport); ultradian rhythm (~90 min) |
| Rhythm | Weekday × hour heatmap (7×24), per-day trend | Chronotype framing and Digital Wellbeing's hourly view |
| Dual device | PC minutes / phone minutes / PC share, phone unlock count | Apple Screen Time's pickups convention |
| Completeness | Count and length of power-off gaps | A locally created aw-offline marker, so "no records" is never mistaken for "no activity" |
Definitions worth knowing before you read the numbers:
- Active time = window events ∩ non-AFK intervals. The PC has an AFK watcher; the phone does not, so phone time is counted directly from event durations.
- Fragmentation uses the median, not the mean: a few long blocks inflate the mean, and the mean then hides what a typical stretch actually looks like.
- Focus blocks accumulate same-category segments with gaps ≤ 2 minutes. It measures "how long you were not torn away", not "how focused you believe you were".
- Phone granularity stops at app level (an Android limitation); in-app pages are not available.
Where the data comes from
The plugin never stores usage history. Every time the panel opens it asks the local aw-server
(default http://127.0.0.1:5600) for events and aggregates them in memory.
- Nothing is written to disk by the dashboard itself.
- Requests only go to loopback; the plugin has no outbound network behaviour.
- ActivityWatch keeps the raw database. Its location depends on your own ActivityWatch install — this repository does not assume or require any particular path.
Endpoints and the model tool
The host half registers two read-only routes under basePath (default /dsh-aw-viz):
GET /dsh-aw-viz/api/summary?days=7   # all metrics
GET /dsh-aw-viz/api/health           # probe whether aw-server is running
Plus one read-only tool for the model, so you can just ask in chat:
| Tool | Arguments | Returns |
|---|---|---|
aw_habit_report | days (1–90, default from config), format (text | json) | A readable summary or the raw metrics |
Where it mounts
Two registrations, following the same pattern as the host's own plugin / automation / context panels:
| Part | Slot | Notes |
|---|---|---|
| Sidebar entry | sidebar.panellist | { id: 'aw-viz', order: 20, label: () => '使用习惯' } plus an icon component; the host renders the row itself, so typography and hover states match its neighbours |
| Panel body | main | { key: 'aw-viz' }, selected with ctx.layout.selectPanel('aw-viz') when the row is clicked |
order: plugins = 0, automation = 10, this panel = 20, skills = 31.
An early version registered into sidebar.brand.mark (the 24px brand slot). That is an icon slot,
not a list — abandoned.
Install
Requirements: DSH desktop (Harness 0.2.x, Web frontend), Node 20+, and a running ActivityWatch with data in it.
The panel HTML/JS is baked into the page at host startup, so every install path ends with an app restart.
1. Clone and install as a local file: plugin (recommended)
git clone https://github.com/woshijing1991-cloud/dsh-aw-viz.git
cd dsh-aw-viz

# let the host write the profile for you (best option)
dsh plugin --profile <your-profile> add "$(pwd)"
Restart DSH. Keep the checkout somewhere stable: the profile references it as a file: dependency,
so moving or deleting the folder makes the profile fail to load.
2. Plugin marketplace
If your DSH build has a plugin marketplace and this package is listed there, install it from the marketplace UI and restart. Nothing else to configure.
3. Manual profile configuration
Three places must agree — a dependency without a cordis.patch.yml insert entry loads but never
mounts, which looks exactly like "installed, nothing happened".
~/.dsh/profiles/<profile>/package.json:
{
  "dependencies": {
    "dsh-aw-viz": "file:/absolute/path/to/dsh-aw-viz"
  },
  "dsh": {
    "profile": {
      "bundles": ["dsh-aw-viz"]
    }
  }
}
~/.dsh/profiles/<profile>/cordis.patch.yml:
- insert:
    - id: dsh-aw-viz
      name: 'dsh-aw-viz'
      config:
        activityWatchBase: 'http://127.0.0.1:5600'
        basePath: '/dsh-aw-viz'
        defaultRangeDays: 7
Then:
cd ~/.dsh/profiles/<profile> && pnpm install
and restart DSH.
Uninstall
Remove the dependencies entry, the dsh.profile.bundles entry and the insert block, run
pnpm install again, restart.
Configuration
Profile config keys (written into the patch layer by the install entry):
| Key | Default | Meaning |
|---|---|---|
activityWatchBase | http://127.0.0.1:5600 | Base URL of your local aw-server; change it if ActivityWatch listens elsewhere |
basePath | /dsh-aw-viz | URL prefix for the two routes; change it if it collides with another plugin |
defaultRangeDays | 7 | Default window when a request does not specify days |
Environment variables used by the optional scripts in tools/ (never by the plugin at runtime):
| Variable | Default | Meaning |
|---|---|---|
AW_BASE | http://127.0.0.1:5600 | Same aw-server endpoint for the export scripts |
AW_DATA_DIR | <repo>/aw-data | Where the scripts write CSV / JSON / weekly reports. Git-ignored |
AW_TZ_CONFIG | $AW_DATA_DIR/user-tz.json | Timezone-offset file written by tools/tz-normalize.mjs and read by the stats module |
AW_TZ_OFFSET_HOURS | system timezone | Force a fixed offset (e.g. 8, -5). Highest priority; use it when you want a specific zone rather than the machine's |
The plugin reads AW_TZ_CONFIG / AW_TZ_OFFSET_HOURS too, so the heatmap buckets hours by your
timezone instead of the machine's system timezone. Your system clock and timezone are never modified.
If you travel or run the host on a server in another region, set
AW_TZ_OFFSET_HOURSexplicitly. It defaults to the host's system timezone; with a wrong offset the 7×24 heatmap and the 24-hour breakdown shift as a block, which looks like the plugin mis-bucketed your day.
Local preview without the host
preview.html renders the dashboard from a bundled snapshot, so you can iterate on lib/page.css
without restarting DSH. Open the file directly; ?scheme=dark switches the theme.
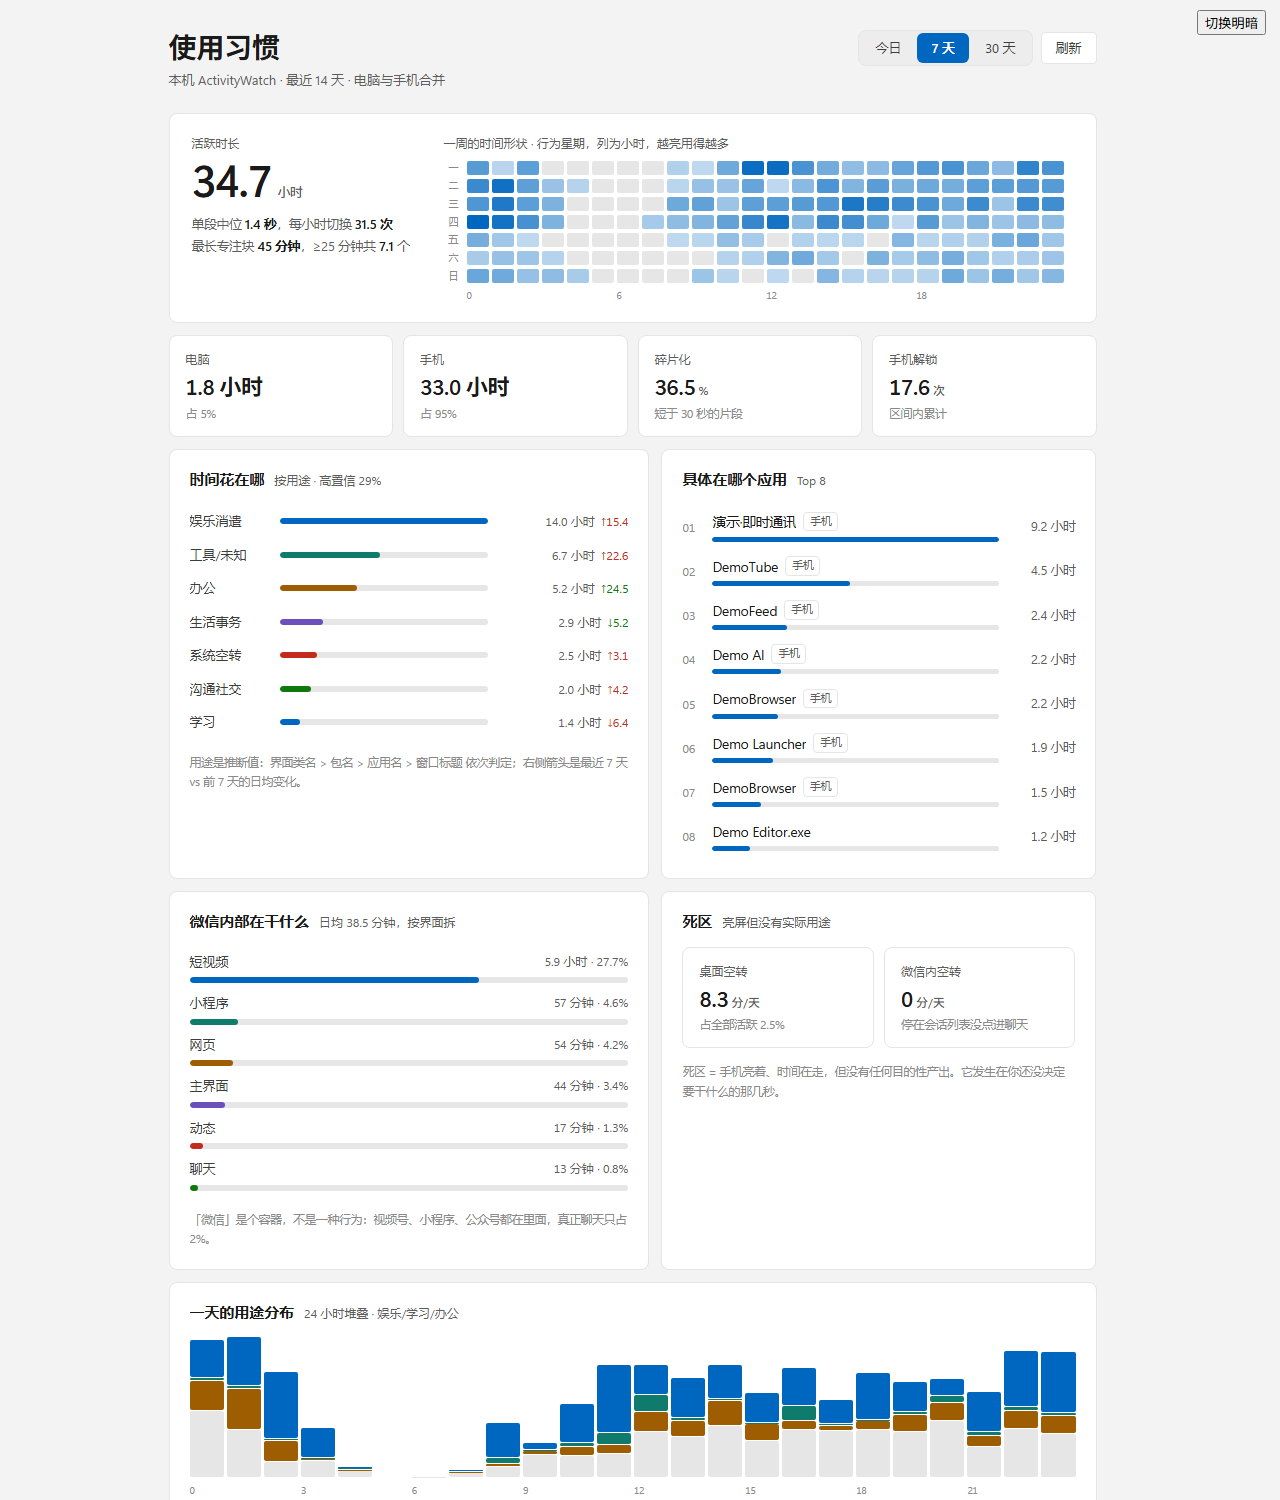
preview.html opened directly — the same demo snapshot, no DSH, no ActivityWatch.
Add ?live=1 to pull real data instead. Inside a file:// page you must name the host explicitly:
preview.html?live=1&base=http://127.0.0.1:<dsh-port>
CSS has exactly one source of truth: lib/page.css. The client plugin cannot ship a <link>, so
tools/build-client.mjs inlines it into lib/client.template.js and writes lib/client.js:
node tools/build-client.mjs          # rebuild after editing page.css
node tools/build-client.mjs --check  # verify only, exit 1 on drift
Design decisions worth keeping (see the frontend-design skill for the reasoning):
| Decision | Why |
|---|---|
| The hero visual is a 7×24 heat grid, not a big number | Time is continuous — express it as a shape. Big number + gradient is the most templated choice available |
| The heat grid is capped at 660px | 24 columns across the full width turn into a barcode; intraday variation disappears |
Six paired light-dark() series colours | One token, one step per theme; nothing goes muddy in dark mode |
| KPIs use a 2px left colour bar instead of a card shadow | Avoids the "identical rounded cards + one soft shadow" template look |
All metric figures use tabular-nums | Digits line up for vertical comparison while scanning |
| The x-axis has five evenly spaced dates plus a peak marker | Labelling only the first and last date is the same as not labelling |
Scrolling and container constraints
The host's centre column is display: flex; flex-direction: column; overflow: hidden.
It clips and does not scroll — scrolling is the panel's own responsibility. If the panel root does
not become a scroll container, overflowing content is cut off and the page cannot be scrolled at all
(the symptom: "renders wrong and won't scroll").
.aw-page   { height:100%; min-height:0; display:flex; overflow:hidden }
.aw-inner  { flex:1; min-height:0; overflow:auto; scrollbar-gutter:stable }
The root node also carries an inline {height:100%, overflowY:auto} fallback, so even if the stylesheet
is blocked the panel does not end up clipped and unscrollable.
Tools
| Script | Purpose |
|---|---|
tools/build-client.mjs | Inline page.css into lib/client.js (--check for CI) |
tools/smoke.mjs | Offline self-check: build drift, demo-data shape, rule hits, no absolute paths |
tools/export-sample.mjs | Export a snapshot of your own data for preview.html — contains real records, do not commit |
tools/classify-export.mjs | Classify every record by purpose and export a CSV |
tools/weekly-report.mjs | Week-vs-week Markdown report focused on the few actionable metrics |
tools/night-watch.mjs | Check last night's late usage against a threshold |
tools/tz-normalize.mjs | Derive your real timezone offset and persist it (never touches system settings) |
Every path above comes from tools/env.mjs, so a fresh clone writes under ./aw-data/ until you point
AW_DATA_DIR somewhere else.
Development
npm run build    # page.css -> client.js
npm run check    # fail if client.js is stale
npm test         # offline smoke test
Conventions worth keeping:
- The host half imports only Node built-ins and relative files. The profile's
node_moduleshas no@deepseek-ai/*; a static import of those fails before the plugin ever activates. - Every registration is wrapped in its own try/catch. One bad schema should not take down the profile.
- The panel owns its scrolling, per the constraint above.
Compatibility
- DeepSeek Harness 0.2.x desktop, Web frontend (
platform: webclient bundle). - Needs a reachable ActivityWatch
aw-server; without it the panel shows a state message instead of numbers. - Node 20+ (global
fetch, ESM). - Host-version sensitive: the panel registers into
sidebar.panellist+main. A host release that renames those slots would drop the panel entry, but would not break startup. - If
Uncategorizedstays high, the rules need feeding — they live inlib/stats.js(CATEGORY_RULES), and order is significant.
Privacy
- Read-only and local. Only
GETrequests to your own ActivityWatch over loopback. No telemetry, no remote assets, no upload. - The dashboard stores nothing. Aggregation happens in memory, per request.
- This repository ships synthetic demo data only (
lib/sample-summary.js). App names and dates in it are invented and the numbers are scaled; it is a rendering fixture, not anyone's history. - If you export your own snapshot with
tools/export-sample.mjs, that file contains real records — it is documented as do-not-commit, andgit checkout -- lib/sample-summary.jsrestores the demo data. - No credentials are involved: the plugin does not read cookies, tokens,
.envfiles or ActivityWatch databases. It talks to the HTTP API only.
License
MIT — see LICENSE. Copyright (c) 2026 CCC (woshijing1991-cloud).
dsh-aw-viz(中文)
一个 ActivityWatch「使用习惯」看板插件:把本机 ActivityWatch 的活动数据做成 DSH 界面里的可视面板—— 时间分配、碎片化、专注块、时段节律、电脑与手机分账,五个视角一屏看完。全部在本机计算,只读。
它的定位不是替你评判这一天,而是把手上的使用数据变成 AI 读得懂的指标。
插件负责把 ActivityWatch 的原始记录算成口径明确的数据,并通过 aw_habit_report 工具暴露给同一个会话里的模型;
真正的分析与建议由 AI 给出——根据这些指标判断你的使用模式哪里值得改,再给出可执行的个性化方案
(什么时候该停、哪类应用在吃时间、碎片化是不是变严重了)。插件本身保持确定性、纯本地,不下判断、不联网。
本插件属于 DeepSeek Harness 生态的第三方插件,不是官方项目。适配:Harness 0.2.x 桌面端(Web 前端)。
由真实面板代码渲染;数字来自虚构的 ActivityWatch 桩,不含任何真实记录。
前提条件
- 本机已经装好并正在运行 ActivityWatch——这个面板只是它的只读视图,自己不采集任何数据。
- 默认读
http://127.0.0.1:5600(aw-server/aw-server-rust的 REST API),换地址改activityWatchBase配置项。 - ActivityWatch 没起来时面板不会崩:
/api/health返回200但{"ok": false, "error": "fetch failed"},汇总接口返回500,界面显示空状态而不是编造数字。 - 已在干净的 headless 环境实测:ActivityWatch 在跑时所有路由
200,模型工具返回真实聚合值。
它分析什么
每一项都对应一个既有框架,不是随手编的口径。
| 维度 | 指标 | 依据 |
|---|---|---|
| 时间分配 | 分类占比、Top 应用、电脑/手机分账 | RescueTime 的 Productivity Pulse / 类别占比口径 |
| 碎片化 | 单段时长中位数、每活跃小时切换次数、短段(<30 秒)占比 | Mark et al. 2008《The Cost of Interrupted Work》;Leroy 2009「attention residue」 |
| 专注 | 最长连续同类段、≥25 分钟的块数 | 《Deep Work》(Newport) / 超日节律(约 90 分钟周期) |
| 节律 | 周一~周日 × 0-23 时热力图、逐日趋势 | chronotype(晨型/夜型)与 Digital Wellbeing 的 hourly 视图 |
| 双端 | 电脑分钟数 / 手机分钟数 / 电脑占比、解锁次数 | Apple Screen Time 的 pickups 口径 |
| 完整性 | 关机空档段数与分钟数 | 本机自建的 aw-offline 标记,避免把「没记录」误读成「没活动」 |
读这些数字之前值得先知道的三件事:
- 活跃时长 = 窗口事件 ∩ 非 AFK 区间。电脑端有 afk watcher;手机端没有,按事件时长直计。
- 碎片化看中位数而不是平均值:平均值会被少数长块拉高,中位数才反映「典型的一段有多长」。
- 专注块按同类目连续、间隔 ≤2 分钟累加。它衡量的是「没有被切走的连续区间」,不是「你以为自己专注了多久」。
- 手机端粒度只到 App 级(Android 的限制),拿不到 App 内页面。
数据从哪来
插件不落库。每次打开面板,实时向本机 aw-server(默认 http://127.0.0.1:5600)取事件、在内存里聚合。
- 看板自己不写任何文件。
- 请求只发往本机回环地址,插件没有任何外发网络行为。
- 原始数据库由你自己的 ActivityWatch 保存,位置取决于你的安装方式——本仓库不假设、也不要求某个固定路径。
两个接口与模型工具
宿主侧在 basePath(默认 /dsh-aw-viz)下注册两个只读路由:
GET /dsh-aw-viz/api/summary?days=7   # 全部指标
GET /dsh-aw-viz/api/health           # 探测 aw-server 是否在跑
另外给模型一个只读工具,可以直接在对话里问:
| 工具 | 参数 | 返回 |
|---|---|---|
aw_habit_report | days(1–90,缺省取配置)、format(text | json) | 可读摘要或原始指标 |
挂载位置
与同栏的「插件」「自动化任务」「上下文洞悉」一致,采用两步注册:
| 部分 | 槽位 | 说明 |
|---|---|---|
| 侧栏条目 | sidebar.panellist | { id:'aw-viz', order:20, label:() => '使用习惯' } + 图标组件;行本身由宿主渲染,所以字体/间距/悬停自动与同栏对齐 |
| 面板正文 | main | { key:'aw-viz' },点击条目时由宿主 ctx.layout.selectPanel('aw-viz') 渲染进来 |
order:插件 = 0,自动化任务 = 10,本插件 = 20,上下文洞悉的技能面板 = 31。
早期版本错注册在 sidebar.brand.mark(左上角品牌 logo 位),那是个 24px 图标位,不是栏目列表,已弃用。
安装
要求:DSH 桌面端(Harness 0.2.x,Web 前端)、Node 20+,以及正在运行且已有数据的 ActivityWatch。
面板的 HTML/JS 由宿主在启动时烘焙进页面,所以任何安装方式最后都要重启 DSH。
1. 克隆后作为本地 file: 插件安装(推荐)
git clone https://github.com/woshijing1991-cloud/dsh-aw-viz.git
cd dsh-aw-viz

# 让宿主自己写 profile(优先用这条)
dsh plugin --profile <你的 profile> add "$(pwd)"
然后重启 DSH。源码目录要放在固定位置:profile 里是 file: 依赖,移动或删除目录会让 profile 加载失败。
2. 市场安装
如果你的 DSH 版本带插件市场、且本仓库已被收录,直接在市场界面点安装,重启即可,不需要别的配置。
3. 手动改 profile 配置
三处都要写。只加依赖、不写 cordis.patch.yml 的 insert,表现就是「装上了但什么也没发生」。
~/.dsh/profiles/<profile>/package.json:
{
  "dependencies": {
    "dsh-aw-viz": "file:/绝对路径/dsh-aw-viz"
  },
  "dsh": {
    "profile": {
      "bundles": ["dsh-aw-viz"]
    }
  }
}
~/.dsh/profiles/<profile>/cordis.patch.yml:
- insert:
    - id: dsh-aw-viz
      name: 'dsh-aw-viz'
      config:
        activityWatchBase: 'http://127.0.0.1:5600'
        basePath: '/dsh-aw-viz'
        defaultRangeDays: 7
然后:
cd ~/.dsh/profiles/<profile> && pnpm install
重启 DSH。
卸载
删掉 dependencies、dsh.profile.bundles 与 insert 三段,重新 pnpm install,重启。
配置
profile 配置键(安装入口会写进 patch 层):
| 键 | 默认 | 说明 |
|---|---|---|
activityWatchBase | http://127.0.0.1:5600 | 本机 aw-server 地址;你的 ActivityWatch 不在这个端口就改它 |
basePath | /dsh-aw-viz | 两个路由的 URL 前缀;与其他插件冲突时改它 |
defaultRangeDays | 7 | 请求没带 days 时的默认时间窗 |
tools/ 下的导出脚本用这些环境变量(插件运行时不依赖它们):
| 变量 | 默认 | 说明 |
|---|---|---|
AW_BASE | http://127.0.0.1:5600 | 导出脚本用的 aw-server 地址 |
AW_DATA_DIR | <仓库>/aw-data | 脚本写 CSV / JSON / 周报的目录,已在 .gitignore 中排除 |
AW_TZ_CONFIG | $AW_DATA_DIR/user-tz.json | tools/tz-normalize.mjs 写、统计模块读的时区偏移文件 |
AW_TZ_OFFSET_HOURS | 跟随系统时区 | 直接指定固定偏移(如 8、-5)。优先级最高,适合想固定某个时区的场景 |
插件本身也读 AW_TZ_CONFIG / AW_TZ_OFFSET_HOURS,所以时段热力图按你所在时区分桶,而不是按电脑系统时区。
系统时钟与时区设置永远不会被改动。
跨时区出差、或在别的时区的服务器上跑宿主,请显式设
AW_TZ_OFFSET_HOURS。默认取宿主的系统时区;偏移不对时,7×24 热力图和 24 小时分布会整体平移,看起来就像插件把你的作息算错了。
不开宿主也能预览
preview.html 用内置快照渲染,改 lib/page.css 时不必反复重启 DSH。直接打开文件即可,?scheme=dark 看深色。
直接打开 preview.html 的样子——同一份演示快照,不需要 DSH,也不需要 ActivityWatch。
加 ?live=1 则改为拉真实数据;file:// 下需要显式给出宿主地址:
preview.html?live=1&base=http://127.0.0.1:<DSH 端口>
CSS 只有一份真相:lib/page.css。客户端插件拿不到 <link>,所以由 tools/build-client.mjs
把它内联进 lib/client.template.js、产出 lib/client.js:
node tools/build-client.mjs          # 改完 page.css 后重建
node tools/build-client.mjs --check  # 只校验,不一致 exit 1
设计要点(依 frontend-design 技能):
| 决定 | 理由 |
|---|---|
| 主视觉是 7×24 热力网格,不是大数字 | 时间连续,就该用「形状」表达;大数字+渐变是最模板化的选择 |
| 热力网格限宽 660px | 24 列铺满全宽会变成条码,看不出一天内的起伏 |
分类用 6 个 light-dark() 成对序列色 | 同一 token 在明暗主题各取一档,深色下不会发黑 |
| KPI 用左侧 2px 色条而非卡片阴影 | 避免「同质圆角卡片 + 同一层柔和阴影」的模板感 |
指标数字全部 tabular-nums | 扫读时能纵向对齐比较 |
| 横轴刻度取 5 个等距日期 + 峰值标注 | 只标首尾两个日期等于没标 |
滚动与容器约束(务必看这条)
宿主的中间列是 display:flex; flex-direction:column; overflow:hidden。它只裁切、不滚动——
滚动责任在面板自己身上。面板根节点不自己成为滚动容器,内容超高就被裁掉,而且整页无法上下滑
(表现就是「显示不正常 + 滑不动」)。
.aw-page   { height:100%; min-height:0; display:flex; overflow:hidden }
.aw-inner  { flex:1; min-height:0; overflow:auto; scrollbar-gutter:stable }
根节点上还写了一份内联兜底 {height:100%, overflowY:auto}——即使样式表被拦,也不会变成裁死且滑不动的状态。
脚本
| 脚本 | 用途 |
|---|---|
tools/build-client.mjs | 把 page.css 内联进 lib/client.js(--check 给 CI 用) |
tools/smoke.mjs | 离线自检:构建漂移、演示数据结构、规则命中、有无本机绝对路径 |
tools/export-sample.mjs | 导出你自己数据的快照给 preview.html——含真实记录,不要提交 |
tools/classify-export.mjs | 按用途归类每条记录并导出 CSV |
tools/weekly-report.mjs | 本周 vs 上周的 Markdown 周报,只报能行动的几个数 |
tools/night-watch.mjs | 按阈值检查昨晚深夜使用 |
tools/tz-normalize.mjs | 推导你的真实时区偏移并落盘(不改系统设置) |
以上路径全部由 tools/env.mjs 推导:新克隆的仓库默认写到 ./aw-data/,要用别处就设 AW_DATA_DIR。
开发
npm run build    # page.css -> client.js
npm run check    # client.js 过期就报错
npm test         # 离线 smoke
三条约定(改代码前先看):
- host 半边只 import Node 内置模块和相对路径文件。profile 的
node_modules里没有@deepseek-ai/*, 静态 import 它们会在插件激活前就失败。 - 每个注册都单独 try/catch。一个坏 schema 不该拖垮整个 profile。
- 滚动容器归面板自己(见上一节)。
兼容性
- DeepSeek Harness 0.2.x 桌面端,Web 前端(
platform: web客户端 bundle)。 - 需要能连上的 ActivityWatch
aw-server;连不上时面板显示状态提示而不是数字。 - Node 20+(全局
fetch、ESM)。 - 与宿主版本相关:面板注册进
sidebar.panellist+main两个槽位。某个宿主版本若改了槽位名, 表现是面板入口消失,但不会导致启动失败。 Uncategorized偏高说明分类规则没养;规则表在lib/stats.js的CATEGORY_RULES,顺序敏感。
隐私
- 只读、只在本机。只对你自己的 ActivityWatch 发
GET,走回环地址;无遥测、无远程资源、不外发。 - 看板不存任何数据。聚合只在内存里、按请求进行。
- 仓库里只有虚构演示数据(
lib/sample-summary.js):应用名与日期是编的、数值按同比例缩放, 它只是渲染夹具,不是任何人的历史记录。 - 如果你用
tools/export-sample.mjs导出自己的快照,那个文件含真实记录——文档里已标注不可提交,git checkout -- lib/sample-summary.js可还原成演示数据。 - 不涉及任何凭据:插件不读 Cookie、token、
.env,也不直接打开 ActivityWatch 的数据库,只走 HTTP API。
许可证
MIT,见 LICENSE。Copyright (c) 2026 CCC (woshijing1991-cloud)。
Clean-install notes / 干净环境验收说明
- A bare
http://127.0.0.1:<port>/answering401is normal when DSH runs asdsh web: the GUI is token-guarded. Use the?token=...URL printed at startup.401does not mean the plugin failed to load — plugin routes are served behind the same token. 以dsh web方式运行时,GUI 带 token 鉴权,裸访问返回 401 是正常的,要用启动时打印的?token=链接;401不代表插件没加载。 - Verified on a clean environment (fresh Ubuntu 24.04 + Node 24 +
@deepseek-ai/dsh, no other plugins): the plugin loads withfailed: [], all of its routes answer200, and its client bundle is present in the merged bundle. 已在干净环境(全新 Ubuntu 24.04 + Node 24 + 单装 DSH,无其它插件)验证:插件加载failed: [],所有路由200,客户端 bundle 已打进合并包。
Comments
Loading…
Similar plugins
by gluztm
Let AI manage AI and take the day off. It minds the flow itself, stops a runaway before it costs you, keeps working while you are away, and asks before touching your workspace.
★ 10
AGPL-3.0
JavaScript
Nov 20, 2026
dsh plugin --profile web add dsh-chiefby Neo65536-engineer
Read-only work reports for DeepSeek Harness: reconstruct what an agent task actually did from session logs — tools used, files read/written, commands run, test results, failures, token usage, and whether it finished. Fully offline, no API key, no data leaves your machine.
★ 2
MIT
JavaScript
Sep 26, 2026
dsh plugin --profile web add dsh-agent-logby KelaoHu
Time-shifting task delegation for DeepSeek Harness (dsh): plan tasks at leisure, they run unattended off-peak, come back to a report. Human-adjudicated, desktop + web.
★ 182
↓ 511/wk
MIT
TypeScript
Nov 16, 2026
dsh plugin --profile web add dsh-lowtideby 2327644800
Personal usage analytics & activity dashboard for the DeepSeek Harness (dsh) web GUI: token totals, session activity, GitHub-style contribution heatmap, model / reasoning-effort / tool / skill / plugin rankings, streaks and insights. Aggregates real session events through ctx.sessionPersistence; no dsh core changes, no prompt content leaves the machine.
★ 0
Apache-2.0
JavaScript
Aug 26, 2026
dsh plugin --profile web add dsh-usage-analyticsby dusktin71-lang
记录 AI 的“愚蠢时刻”(被用户纠正、答非所问、工具报错等),把教训沉淀成可管理的清单,并在后续每一次对话中自动注入系统提示词,让本地模型不再重复犯同样的错。
★ 0
MIT
JavaScript
Oct 12, 2026
dsh plugin --profile web add dsh-ai-lessonsby yiliang114
Activity and Favorites views for DeepSeek Harness: track running, waiting, and unread sessions across workspaces.
★ 4
↓ 324/wk
MIT
JavaScript
Oct 25, 2026
dsh plugin --profile web add @yiliang114/dsh-session-deck