

dsh-carbon
Identified★ 1Estimated carbon footprint of your DeepSeek Harness sessions: sourced factors, confidence bands, durable local history, and a GUI
dsh-carbon



Track the estimated carbon footprint of your DeepSeek Harness sessions, in the terminal and in the web GUI.
It takes the idea behind claude-carbon, a local estimate built from token counts with a sourced methodology, and applies it to DeepSeek. The numbers are not ported. The published evidence for DeepSeek is much thinner, and borrowing Anthropic's factors would have produced a confident figure with nothing behind it.
  dsh-carbon: carbon footprint of your DeepSeek Harness sessions
  ──────────────────────────────────────────────────────────────

  Estimated       238.7 g
  Plausible range 119.4 g – 716.1 g

  8,384,774 tokens over 126 model calls, 4 sessions
  input 214,769 · output 113,045 · cache reads 8,056,960 (96% of tokens)
  API-equivalent cost at peak tariff: $0.2484

  ≈ 1.4 km driven by car
  ≈ 9.9 kettle boils

  Per session
  ◐ 2026-10-28 03:14     66.7 g  ████████           deepseek-v4.1-flash
  ◐ 2026-10-28 03:02    143.0 g  ██████████████████ deepseek-v4.1-flash
  ◐ 2026-10-28 02:48     11.7 g  █                  deepseek-v4.1-flash

  Where it comes from
  ◐ deepseek-v4.1-flash    238.7 g  100%  derived

  Confidence
  4 of 4 sessions ran on a model with NO published energy measurement.
The web GUI
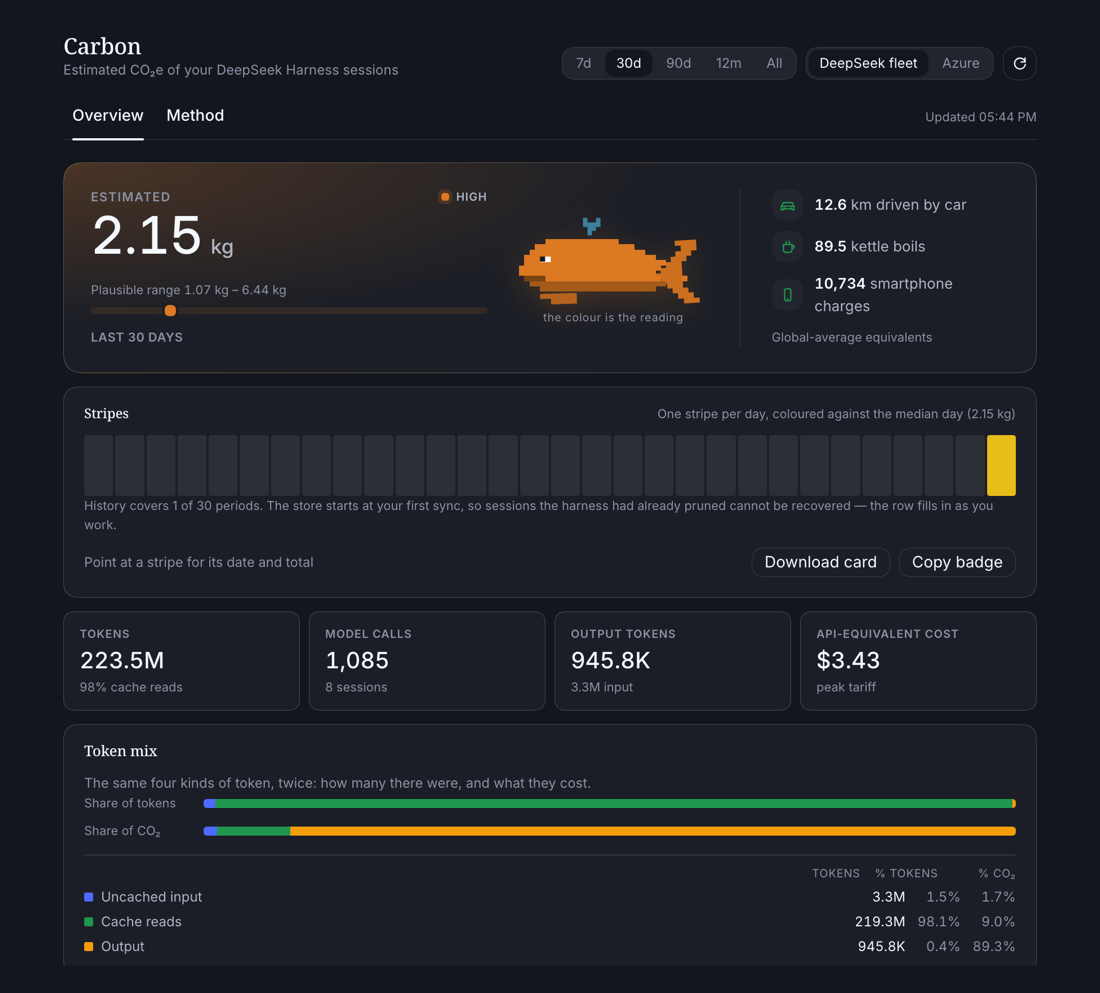
The plugin adds a Carbon row to the sidebar and opens a page in the main panel.
The page leads with a whale, and its colour is the reading: the same green to yellow to red ramp as the hero, on the same log scale, green up to 250 g and red from 5 kg. It blinks, and beats its fluke faster as the figure climbs. One character map in lib/core/whale.mjs draws it for the page and for the exported card, so the whale on your card is the one you saw on screen.
Under it the estimate is never shown alone. There is a low/high band beside it and a marker showing where the point estimate sits inside that band. Below that, a row of stripes: one per day, week or month, coloured against the median period rather than a maximum, so a quiet week still reads as a stripe next to a busy one. Hovering or tabbing to a stripe names its date, total and session count. The toolbar switches the window between 7 days, 30, 90, 12 months and all time, remembered per browser, and shows the change against the previous window of the same length whenever there is one to compare.
Then two bars split the same four kinds of token twice: how many there were, and what they cost in grams. Almost every token in a session is a cache read, and cache reads come to roughly a tenth of the grams. Output is half a percent of the tokens and nine tenths of the footprint. One bar would have hidden that.
The rest is smaller. Equivalents in km driven, kettle boils and phone charges, from the same world-average factors the CLI uses. A switch between DeepSeek's own fleet and Azure that applies to every number on the page, totals, sessions, models, stripes and equivalents alike, and is remembered per browser. A Method tab with the formula, the deployment assumptions, each factor row with its tier, band, caveat and source, and the cross-checks underneath. English and Chinese, following the host locale, laid out for narrow main columns.
Two buttons sit under the stripes. Download card renders the 1200×630 card as a PNG in the browser, with no native dependency, falling back to the SVG if the canvas refuses. Copy badge puts a shields.io markdown line on the clipboard. Both are described in Sharing.
The page refreshes every 30 seconds while it is visible, when the window regains focus, and on demand. The refresh button skips the host's 5-second cache.
One restart for the first install. The host caches whether a package has a
dsh.clienthalf for the lifetime of the process, so adding the browser half to an already-running harness needs one restart (or app relaunch) before Carbon appears in the sidebar, and again after the browser half's declaration changes. Rebuilding the bundle alone hot-reloads; a host-side change takes effect on the next recomposition.
Install
Requirements: DeepSeek Harness 0.2.1-rc.3 or newer (declared in dsh.engines.dsh), and Node 22.15+ only if you want the standalone CLI. The plugin itself runs inside the app.
As a plugin. The GUI is this half; the CLI comes with it.
dsh plugin --profile desktop add dsh-carbon
That forwards to pnpm add inside the profile and appends the package to dsh.profile.bundles, so the only manual step left is restarting the harness once, which is when the browser half is discovered. If dsh is not on your PATH, it ships inside the app:
"/Applications/DeepSeek Harness.app/Contents/Resources/runtime/cli/bin/dsh" \
  plugin --profile desktop add dsh-carbon
After the restart the page lives in the sidebar as the Carbon row, between Automation tasks and More:
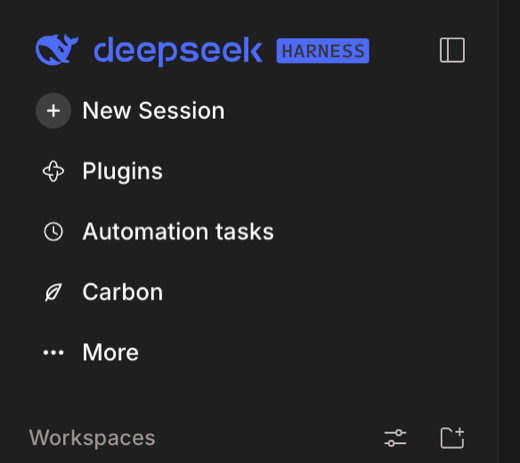
desktop is a profile name, and it is whatever your install called it. Check before you type it:
ls ~/.dsh/profiles
A mistyped name is not an error. --profile destkop quietly creates a second, empty profile and installs the plugin into it, where the app will never look. If the Carbon row does not appear after a restart, check that first.
Without npm, the same tarball is attached to every release, and dsh plugin --profile desktop add <tarball URL> accepts it too. By hand it is pnpm add dsh-carbon in the profile directory plus a "dsh-carbon" entry in dsh.profile.bundles.
The CLI alone, on Node 22.15 or newer:
npx dsh-carbon report
From a clone instead: node bin/dsh-carbon.mjs report.
Commands
| Command | What it does |
|---|---|
dsh-carbon | The report: totals, band, per-session and per-model, split by kind of token |
dsh-carbon timeline | The stripes row in blocks, totals, the median period and the four kind shares |
dsh-carbon sync | Bring the store up to date with the session logs |
dsh-carbon recompute | Reprice every stored session from its token counts |
dsh-carbon card | Write the shareable SVG card (--out, --stdout) |
dsh-carbon badge | Print a shields.io badge for a README (--svg) |
dsh-carbon pr | The repository's footprint since the branch point, posted to its pull request (--dry-run, --pr N) |
dsh-carbon sessions | One line per session |
dsh-carbon json | Machine-readable output |
dsh-carbon methodology | Every factor, its source, its band and its caveats |
Every reading takes --range 7d|30d|90d|12mo|all, --since YYYY-MM-DD, --until YYYY-MM-DD and --infra china|azure|aws. report also takes --limit N.
Environment: DSH_CARBON_INFRA=azure for the alternative-fleet reading, DSH_HOME to point at another harness home, DSH_CARBON_HISTORY to move the store.
The store
Sessions live in ~/.dsh/carbon/history.jsonl, one line each. The window, the stripes, the median and the change figure all come from that file.
Two decisions there are worth explaining.
Rows store tokens, not grams. Conversion happens on every read, using the factors in force at that moment, so correcting a factor re-prices the whole history with no migration step and no stale rows. recompute prints that total; it does not rewrite anything. What is stored is what was measured, meaning how many tokens of each kind crossed the wire. What is derived stays derived.
JSONL rather than SQLite. The file has to be readable and diffable by a person. The claim this tool makes is that you can check its arithmetic, and a database you need a shell to open works against that. A few thousand rows is a few hundred kilobytes, well below the point where the format matters.
Sync is incremental. Each row remembers the size and modification time of the log it came from, so an unchanged log is stat'd rather than parsed, and only a session that has grown is read again. When the harness prunes a transcript the row stays, which is the point of keeping the file at all, and the page reports how many of the total come from logs it can no longer check.
Sharing
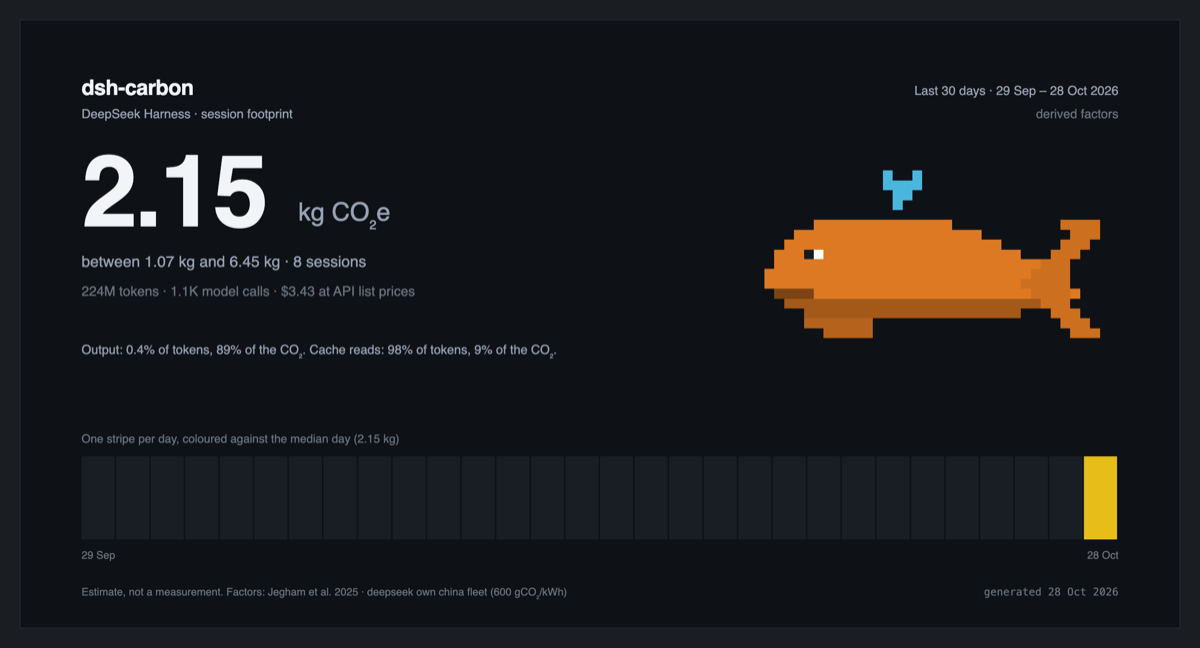
card.svg is a 1200×630 card carrying the figure, its band, the fleet the factors assume, the stripes and the kind split, signed with the one sentence it should be signed with: estimate, not a measurement. It is rendered on the host as SVG, so the export path needs no browser, no native module and no network call. The page rasterises it in your browser when you ask for a PNG. card --out and badge --svg write the same files from the CLI.
badge prints a static shields.io markdown line whose message is the figure and the month it was taken. Static is deliberate. A live badge would publish your footprint to a third party every time someone loaded your README.
pr sums the stored sessions whose working directory sits inside the current repository, from the point the branch left the default branch, and posts one sticky comment through your own gh auth. It is weaker than claude-carbon's attribution and says so. A branch is not recorded in a harness session log, so this is attribution by repository and time: it includes any session that ran in the same repository in that window, on any branch, and excludes work done before the branch point. --dry-run prints the comment and posts nothing.
The honest part
claude-carbon can lean on measured per-token energy for the model family it tracks. This cannot, and the difference is worth stating plainly.
What is measured. Jegham et al. 2025 (arXiv:2505.09598v6), Table 4, is the only public source of per-query inference energy covering DeepSeek. It measures DeepSeek-V3 and DeepSeek-R1 on DeepSeek's own Chinese datacenters and on Azure, at three prompt shapes.
What is not. It covers no V3.1, V3.2, V4, V4-Pro or Flash checkpoint. EcoLogits carries no DeepSeek model at all, so unlike claude-carbon's Opus/Haiku rows there is no second measurement to bracket the extrapolations against. A Tier-3 cross-check is shown on the Method tab, but it is an estimate, not a bracket. The model this harness runs by default, deepseek-v4.1-flash, has no published energy measurement whatsoever.
So the table is graded. Every row carries a tier, and both the report and the GUI show the tier of whatever they used:
| Model | Tier | Why |
|---|---|---|
deepseek-v3 | measured | Fitted to the published per-query energies. Mean error 2.0%. |
deepseek-r1 | measured | Same source, but the fit is poor: mean error 30% (see below). |
deepseek-v4.1-flash | derived | Scaled from V3 by active-parameter ratio, from the released config.json. |
deepseek-v4-pro | extrapolated | No measurement and no released config. Widest band. |
Deriving V4.1-Flash
V4.1-Flash has open weights, so its architecture is at least checkable. The released config gives 40 layers, 384 routed experts of intermediate width 2304, 6 active per token, 1 shared expert, plus MLA attention: about 14.2B active parameters against V3's ~37B.
Both prefill FLOPs and decode bytes scale with active parameters, so both factors scale by the same ratio:
V4.1-Flash factor = V3 factor x (14.2B / 37B) = 0.38x
  input  28 g/Mtok -> 11 g/Mtok
  output 5289 g/Mtok -> 2028 g/Mtok
That is arithmetic from a released config. The assumption underneath it, that energy per active byte on DeepSeek's V4 serving stack matches V3's, is not verified. That is where the 0.5x-3.0x band comes from, and why the row is derived rather than measured.
Why R1's factor is worse than V3's
Fitting energy = a*input + b*output to the three published R1 points gives a 30% mean error, against 2.0% for V3. The reason is diagnostic rather than cosmetic: R1 costs ~19 Wh even for a 100/300-token prompt. Most of its energy is fixed per query (long reasoning traces, prefill, scheduling) rather than proportional to tokens. A token-only model therefore under-reports short R1 sessions and over-reports long ones.
dsh-carbon reports that error instead of hiding it. A per-query intercept term would fit better, but it needs a count of requests that the log does not cleanly provide, so the limitation is documented rather than papered over.
Why the input factor is the weak one
The three published points are close to collinear, so the input and output terms trade off almost freely. Unconstrained least squares puts the input coefficient slightly negative for the DeepSeek rows, which is obviously wrong and a sign that the data cannot separate prefill from decode. The derivation script therefore uses non-negative least squares and carries the input term across from the Azure fit, where it is positive and identifiable, rescaled to the China grid. It is a borrowed number, labelled as such.
Deployment dominates
Jegham et al. measured the same DeepSeek-V3 at 13.162 Wh on DeepSeek's own Chinese datacenters and 3.696 Wh on Azure. A 3.6x gap from PUE, cooling and grid carbon intensity alone, wider than the gap between most model families.
So the fleet assumption matters more than the model. The default is DeepSeek's own fleet, because DeepSeek Harness runs on DeepSeek's first-party API, and it is also the pessimistic reading. DSH_CARBON_INFRA=azure shows the optimistic one. The GUI's fleet switch does the same for a single page without touching the environment.
Cross-checks
A second number is useful only if its limits travel with it. Know Your Compute (July 2026) is a transparent Tier-3 calculator: for models without disclosures it estimates per-query energy from GPU power, model size and benchmark latency. Its DeepSeek-V4-Flash page gives 1.0 Wh and 0.53 g CO₂e per query on a 525 gCO₂/kWh China grid.
That is a sibling estimate, not a measurement of V4.1-Flash, and the site does not publish the prompt shape behind the number. Read against the paper's shapes:
- at 100 input / 300 output, this tool's V4.1-Flash factor implies 1.02 Wh (0.53 g at 525 g/kWh), essentially the site's figure;
- at 1,000 / 1,000 it implies 3.4 Wh, so the agreement depends on the shape.
Its V4-Pro figure (6.0 Wh) is six times its V4-Flash figure and sits at the top of this tool's 0.5-6x band: evidence that the point estimate may be low, not evidence that it is wrong. Its V3 page is the cautionary example instead. It says 2.0 Wh for a medium prompt, while the paper's China points are 2.777 / 8.864 / 13.162 Wh, and 2.0 Wh is close to the Azure medium point (2.165 Wh) paired with the China grid. That row is shown as not used.
The GUI's Method tab lists all three with their URLs and verdicts. None of them enters the arithmetic, and none changes a factor. A Tier-3 estimate cannot narrow a band whose width comes from physics nobody has measured.
How it works
grams = ((input + cacheWrite) * inputFactor
       + cacheRead * inputFactor * 0.08
       + output * outputFactor) / 1e6
Cache reads are a prefill residual at 8% of the input factor. DeepSeek's 0.02 cache-hit price ratio is not an energy ratio and is deliberately not used.
Token counts come from the session logs under ~/.dsh/sessions/*/*/session.v4.jsonl.zstd, reading data.usage on assistant/message events and attributing each message to data.message.source.model, so a mid-session model switch is priced correctly. inputTokens already excludes cached tokens. sync folds those logs into the store (see The store), and every reading is priced from the store rather than the logs, so a pruned transcript no longer loses its footprint.
Assistant messages are deduplicated by message.id. A resumed or compacted session can replay messages that are already in the log, and counting a replay twice inflates the token sum with no symptom other than a larger footprint. claude-carbon found roughly 3x inflation from this. Across the logs read here no session had a repeat, so the count of ignored replays is reported rather than quietly absorbed.
One implementation detail is worth knowing. The harness appends to these logs, one zstd frame per flush, and a live log had 168 frames. Node's zstdDecompressSync decodes only the first frame and silently returns a truncated log. This walks every frame, validating each candidate boundary by attempting the decode, and drops a half-written trailing frame, which Node decodes to a partial line rather than throwing. Without that, history would be silently under-reported by an order of magnitude.
HTTP routes
The host plugin registers read-only routes, loopback-only and same-origin fenced. The GUI is a client of the same routes, so anything the page shows is available to a script.
| Route | Returns |
|---|---|
GET /dsh-carbon | The window: totals, buckets, kind split, models, sessions |
GET /dsh-carbon/summary | Same |
GET /dsh-carbon/timeline | The same payload without the model and session rows |
GET /dsh-carbon/sessions | Session rows only |
GET /dsh-carbon/methodology | The full factor table with tiers, sources, equivalences and cross-checks |
GET /dsh-carbon/card.svg | The shareable card (?download=1 sets a filename) |
GET /dsh-carbon/badge.svg | A shields-style badge of the all-time total |
All of them accept ?range=7d|30d|90d|12mo|all, ?since=, ?until=, ?infra=azure|china|aws, and ?fresh=1 to bypass the 5-second read cache. /summary and /sessions also take ?limit=N (1 to 200 session rows, default 50). The payload carries totals (tokens by direction, calls, cost, measured/unmeasured), buckets (one per period, with its colour and load), kinds (tokens and grams per kind, with both shares), a models roll-up keyed by factor row, the world-average equivalences, and the session rows. Every gram figure is on the selected fleet, scaled exactly once.
Development
npm test                 # 65 tests: factors, folding, store, windows, exports, client bundle
npm run build:client     # rebuild lib/client.js from src/client/
lib/client.js is committed and is the artifact the harness serves, so edit src/client/ and rebuild rather than touching it. The bundle is built with esbuild, keeps React external against the shell's shared module table, and registers dsh-carbon on window.__ModuleLoader__ in the format the client module system expects. The test suite loads that built bundle through a stubbed loader and renders the page with react-dom/server, so a broken bundle fails npm test rather than a user's sidebar.
Tests
npm test                 # 65 tests; `npm install` first for the 9 browser tests
node --test test/*.test.mjs
65 tests, including one that regenerates lib/factors/factors.json from tools/derive-factors.mjs and fails if the two have drifted, so the published numbers cannot silently diverge from their stated derivation. The report tests cover fleet scaling, the session-row cap, model roll-up and empty history. The client tests cover registration, both locales, the rendered rows, the method table, the heat scale's thresholds and hue direction, and the cross-check card. The store tests prove the two properties the design rests on: a session survives the deletion of its log, and an unchanged log is not parsed again. The export tests pin the invariant that matters most, that the buckets and the four kinds each sum to the window total, on every fleet.
Artwork
The icon, the logo and the four banners come from the same sprite the page renders. node scripts/make-art.mjs writes the SVG, and node scripts/make-png.mjs renders each one to PNG in a headless Chrome at its own size. The whale in the banner is the whale in the app, so a change to the sprite moves every asset with it.
| File | Size | Use |
|---|---|---|
icon.svg | 64×64 | the plugin's row in the harness |
docs/logo.png | 512×512 | avatar slot, README badge |
docs/banner-horizontal.png | 1280×640 | repository social preview, link cards |
docs/banner-square.png | 1080×1080 | square posts |
docs/banner-vertical.png | 1080×1350 | portrait posts |
docs/banner-story.png | 1080×1920 | stories: content stays clear of the top 250px and the bottom 340px Instagram covers |
Publishing
Nothing in this package is tied to the author's machine: no absolute paths, no hard-coded home directory, no network call on any read path. The store is per-user at ~/.dsh/carbon/history.jsonl (override with DSH_CARBON_HISTORY), and the plugin writes nothing else.
A plain git clone && node --test test/*.test.mjs runs the arithmetic without installing anything. The nine browser tests skip themselves with a note, because React is a devDependency and the shipped bundle never contains it.
A npm pack tarball installs cleanly into an empty project and produces a report against any DSH_HOME. The core test files also run from the installed package.
It ships by two routes carrying the same bytes: the npm package dsh-carbon, and a .tgz attached to each GitHub release for anyone who would rather not depend on the registry. homepage and repository are set, because the badge markdown and the page's Copy badge button link there.
Releasing a new version:
npm test                 # `prepublishOnly` runs it anyway
npm version patch        # or minor / major; commits and tags
git push --follow-tags
npm publish              # needs a granular token with "bypass 2FA"
gh release create v$(node -p "require('./package.json').version") \
  ./dsh-carbon-$(node -p "require('./package.json').version").tgz
The community registry at awesome-dsh-plugin.com indexes GitHub repositories rather than receiving submissions, and lists a one-line install command per entry (dsh plugin --profile web add <package>). 3,823 of its 7,406 entries are npm packages. There was no carbon-footprint plugin in it when this was written.
Limits
- V4.1-Flash and V4-Pro figures are not measurements. Treat them as an order of magnitude.
- The store is only as old as its first sync. Sessions the harness pruned before you installed this are gone, and nothing can rebuild them. From the first sync on, history survives pruning.
- The band is judgement, not a confidence interval. It has no statistical basis. It is the range the author would defend.
- Costs use the peak tariff, because a historical report cannot know which tariff applied. Off-peak is exactly half. The GUI's cost stat does not change with the fleet switch, since it is API pricing rather than electricity.
- No per-request tracing. One number per model per direction, like
claude-carbon. - Cross-checks are estimates, not factors. Know Your Compute's numbers appear on the Method tab for comparison and never enter the arithmetic. Its V3 row is explicitly rejected because it mixes an Azure energy reading with the China grid.
- The GUI and the routes are read-only. They read the store and never write to the profile. The only thing the plugin writes is its own
history.jsonl.
Licence
MIT. Factor values are derived from published research; see lib/factors/factors.json for per-row citations.
Comments
Loading…
From the same category
by awesome-dsh-plugin
A curated list of plugins for DeepSeek Harness (dsh) · DeepSeek Harness 插件精选列表
★ 21.4k
CC0-1.0
Python
Oct 28, 2026
by 0xsline
DeepSeek Harness (DSH) ecosystem: curated plugins, tools, and infrastructure from dsh-external/hub and the public dsh-plugin topic.
★ 1.3k
CC0-1.0
Python
Oct 16, 2026
by Yuuyuko-uu
DSH 鱼的记忆:给会话一份会淡忘的长期记忆,每条都带时间
★ 361
MIT
JavaScript
Oct 29, 2026
dsh plugin --profile web add dsh-fish-memoryby pax-beehive
Open-source CLI, schemas, resolver, and DSH agent tools for DSH Plugin Hub
★ 277
MIT
TypeScript
Oct 20, 2026
by xiajiajun516
DeepSeek Harness (DSH) backup & restore plugin — export, import, migrate and sync your complete DSH configuration, plugins, MCP servers, skills and workspace. One-click migration to another machine.
★ 268
MIT
TypeScript
Oct 28, 2026
dsh plugin --profile web add dsh-config-managerby ECNU
DBLP and arXiv literature search, BibTeX retrieval and full-text acquisition with session-owned background jobs; an EduWork-maintained fork of SihanLv/dsh-literature.
★ 255
MIT
JavaScript
Oct 28, 2026