

dsh-token-heatmap
Manifest validA daily Token-usage heatmap for the DSH settings page. Aggregated entirely from local session logs; no external requests and no separate usage ledger. | Daily Token usage heatmap in DSH settings, data sourced entirely from local session logs, with no external requests initiated, and no need for...
dsh-token-heatmap
中文 | English
A daily token-usage heatmap that adds a "Token usage" section to the DSH settings page. One cell per day; theme-aware greyscale indicates relative usage.
All data is derived from DSH's own local session logs. No external network requests and no separate usage ledger.
Privacy: this plugin makes no outbound requests. Session logs are read on the local machine only, and the aggregated result is served to your local DSH page. The repository contains no personal data or credentials.
Design highlights
- A native settings section, not an overlay. The component registers into the
settings.sectionslot and renders React elements only. It does not append todocument.body, does not replace the application root, and imports no Harness client package. It therefore occupies the settings sidebar alongside the built-in sections rather than floating above the application. See Implementation notes. - Local data only, single source of truth. No data leaves the machine and no additional ledger is required: every figure is derived from the session logs DSH already writes.
- The session log format is parsed explicitly. Concatenated zstd frames, replayed
seqvalues and truncated tail frames are each handled as distinct cases. A single-pass decompression retains only the first frame of a multi-frame log and therefore under-reports usage. See Data source. - Colour levels remain readable at both ends of the scale. The four metrics differ by orders of magnitude, so levels are derived from quantiles of the local data set (25th/50th/75th percentiles) rather than fixed thresholds. Cache reads frequently account for the majority of a day — 99% in the screenshots below — which is why
Input+outputis provided as a separate metric. - Brightness is reserved for days with recorded usage. Days without usage occupy the lowest visual level, so an otherwise empty grid remains visually neutral and days with usage are distinguishable at a glance. This carries an accessibility benefit as well: the encoding never relies on colour hue.
- Selection and expansion are separate states. Collapsing a day's details retains its selection outline on the heatmap; selecting another day switches the details directly;
Esccollapses first and clears the selection second. Reading a sequence of days therefore requires no intermediate close step. - Host integration for theme and language. Colours are drawn from host theme tokens (
--dsw-alias-*), and all visible text is registered throughctx.locale.register, so an application language change re-renders the section. Number units are localized as well (万/亿in Chinese,K/M/Bin English). - Regression tests rather than claims. Five self-test entry points cover frame parsing, deduplication, caching, weekly boundaries, client rendering and route registration. See Layout.
Screenshots
Note on screenshot currency. The images below predate v0.4.1 and have not been re-captured since. Two UI changes introduced in v0.4.1 are therefore not visible in them:
- Empty-day cells render darker. Previously, a day without recorded usage was drawn at a mid-level grey, close to the lowest usage level; such cells now occupy the dimmest level, reserving the brightness range for days with usage.
- Collapsing a day retains its selection. Selecting the same date again collapses only the detail body; the selection outline remains on the heatmap and the collapsed row carries an expand control.
The textual descriptions throughout this document reflect the current behaviour.
Half-year heatmap and compact tooltip
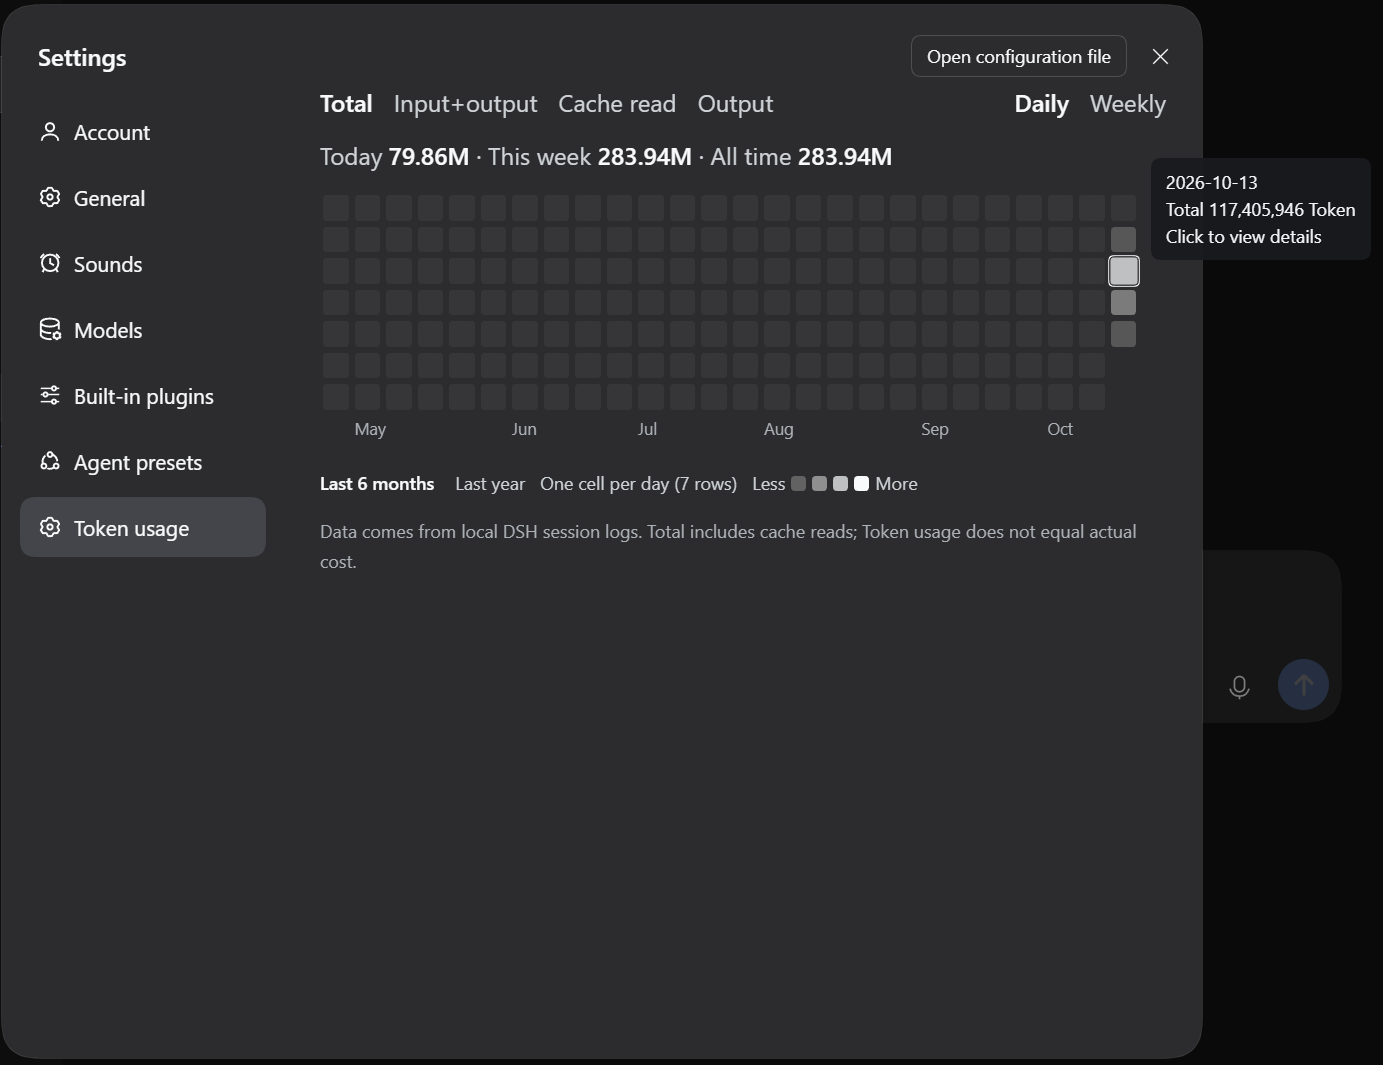
Open Settings → Token usage. The default range is six months. Choose total, input+output, cache read or output, and switch between daily and weekly views. The range selector offers six months or a full year; the year is split into two rows.
Hover a date cell to display three lines: the date (YYYY-MM-DD), the selected metric's Token count, and “Click to view details”. The example below shows 2026-10-13 with a total of 117,405,946 Token. Selecting the cell displays that day's breakdown below the heatmap. The outline indicates hover or selection; today's cell has no default highlight. Cells with no recorded usage remain at the dimmest level, so the brightness range is reserved for days with usage.
Inline daily details and Token composition
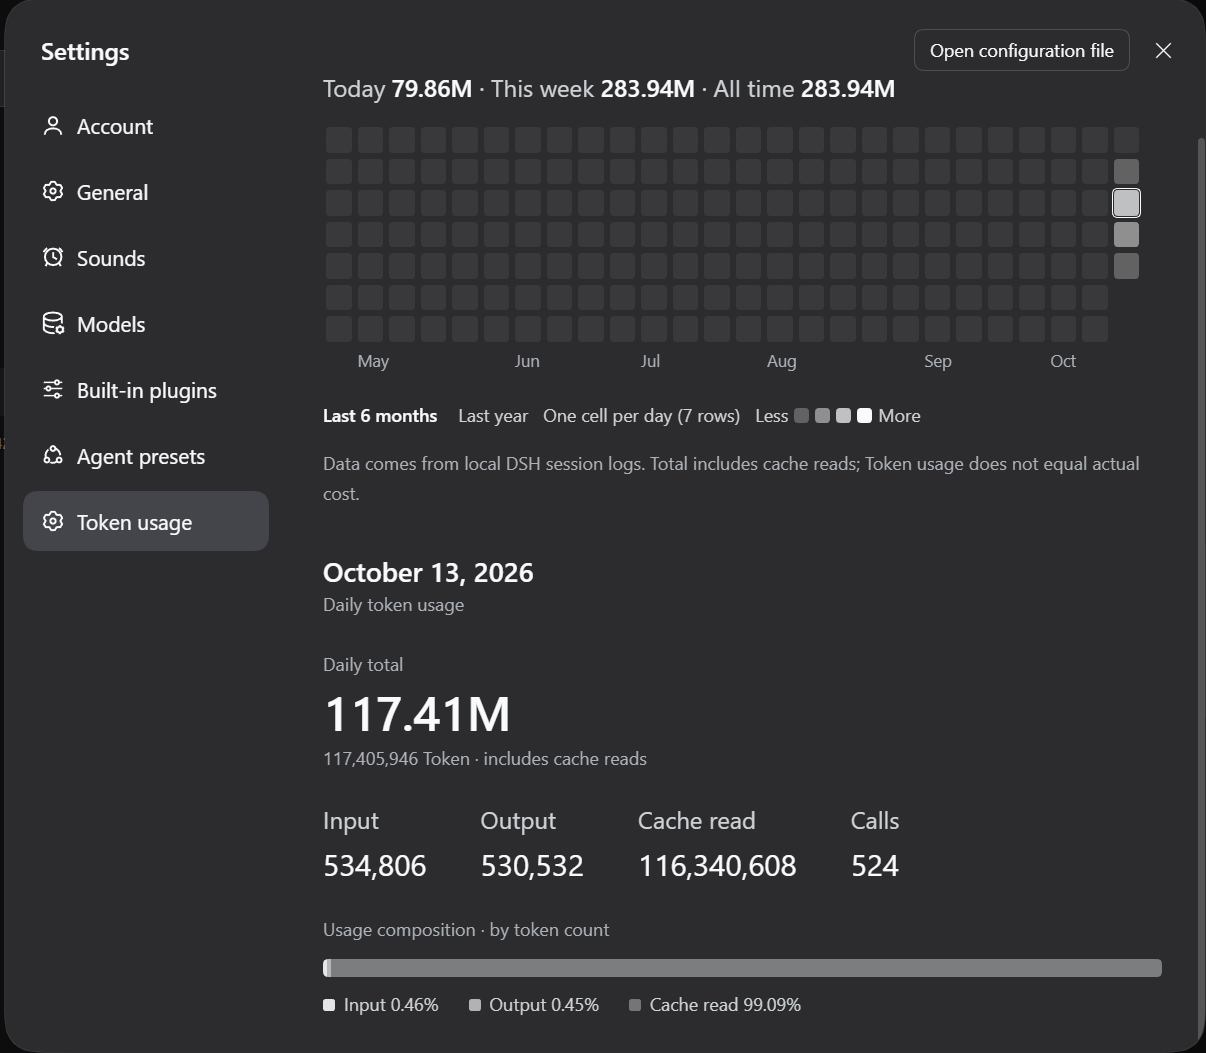
Selecting a date displays its details inline below the heatmap, without navigating away from the page. A single-line hint above the footnote indicates the interaction until a date is selected. Selecting the same date again collapses the detail body while retaining the selection outline on the heatmap, so the selected date remains identifiable; the collapsed row provides an expand control. Selecting a different date switches the details directly, with no intermediate collapse step. For keyboard users, Esc on a focused cell collapses the details, and a second press clears the selection. All filters remain available throughout.
Details include the total, input, output, cache reads and calls, plus cache writes when present. The grayscale bar shows each component's share by Token count. The October 13, 2026 example shows 117,405,946 Token, with cache reads accounting for 99.09%. These are screenshot examples; your statistics come from your local logs.
Chinese interface
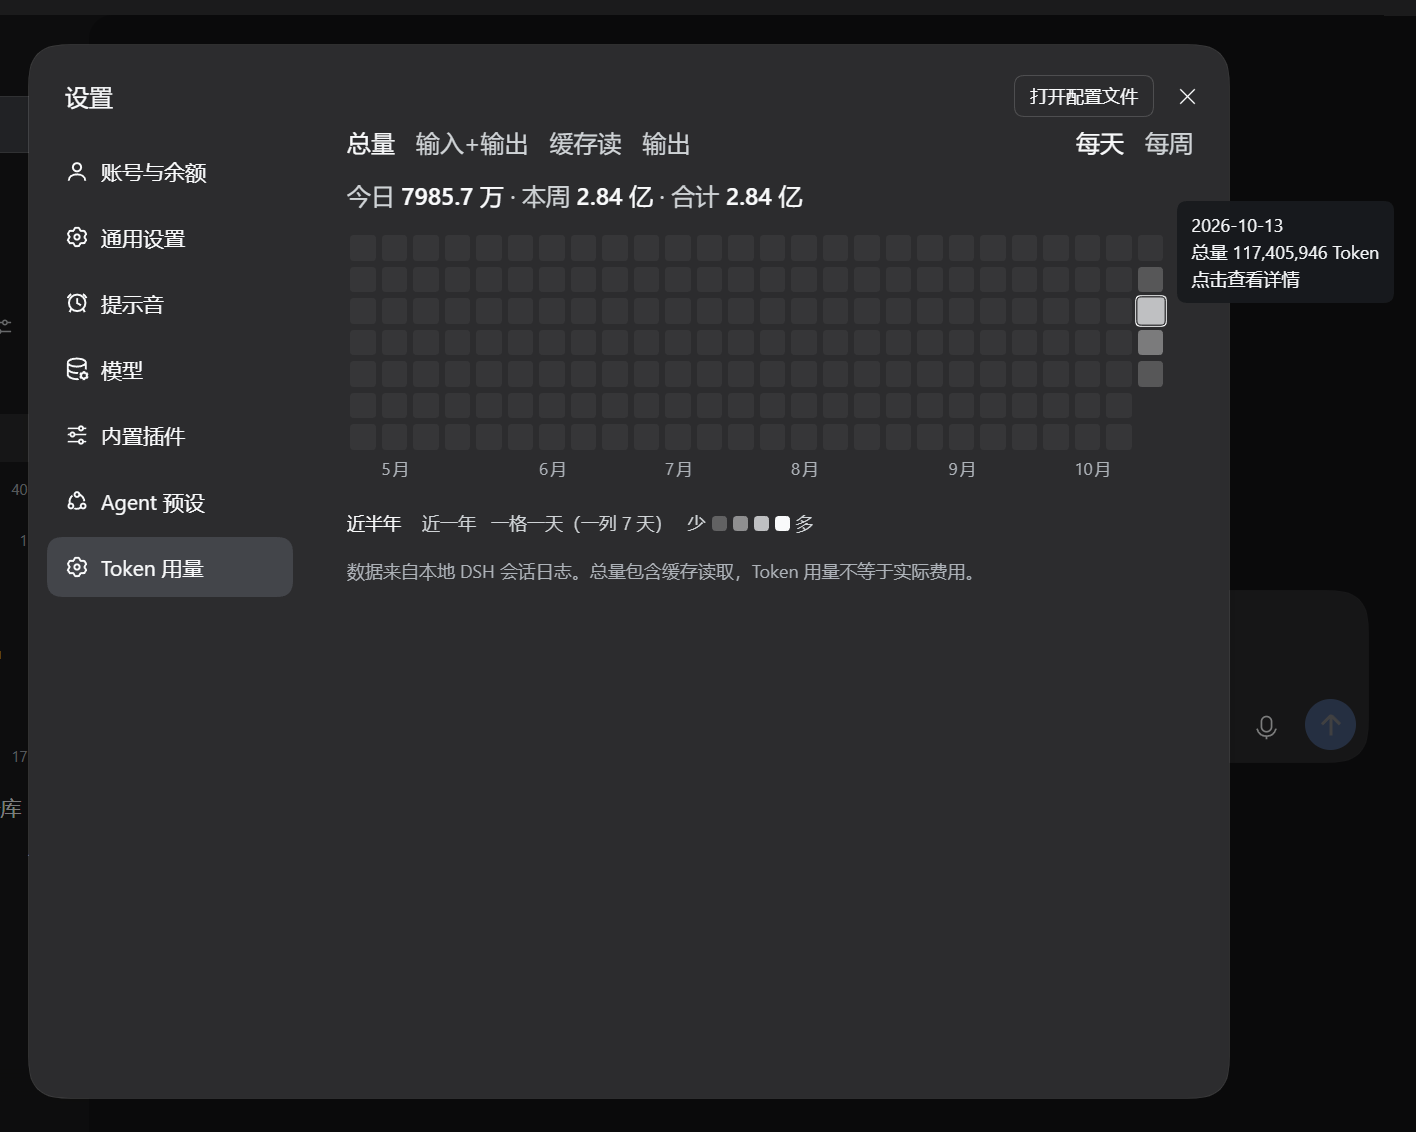
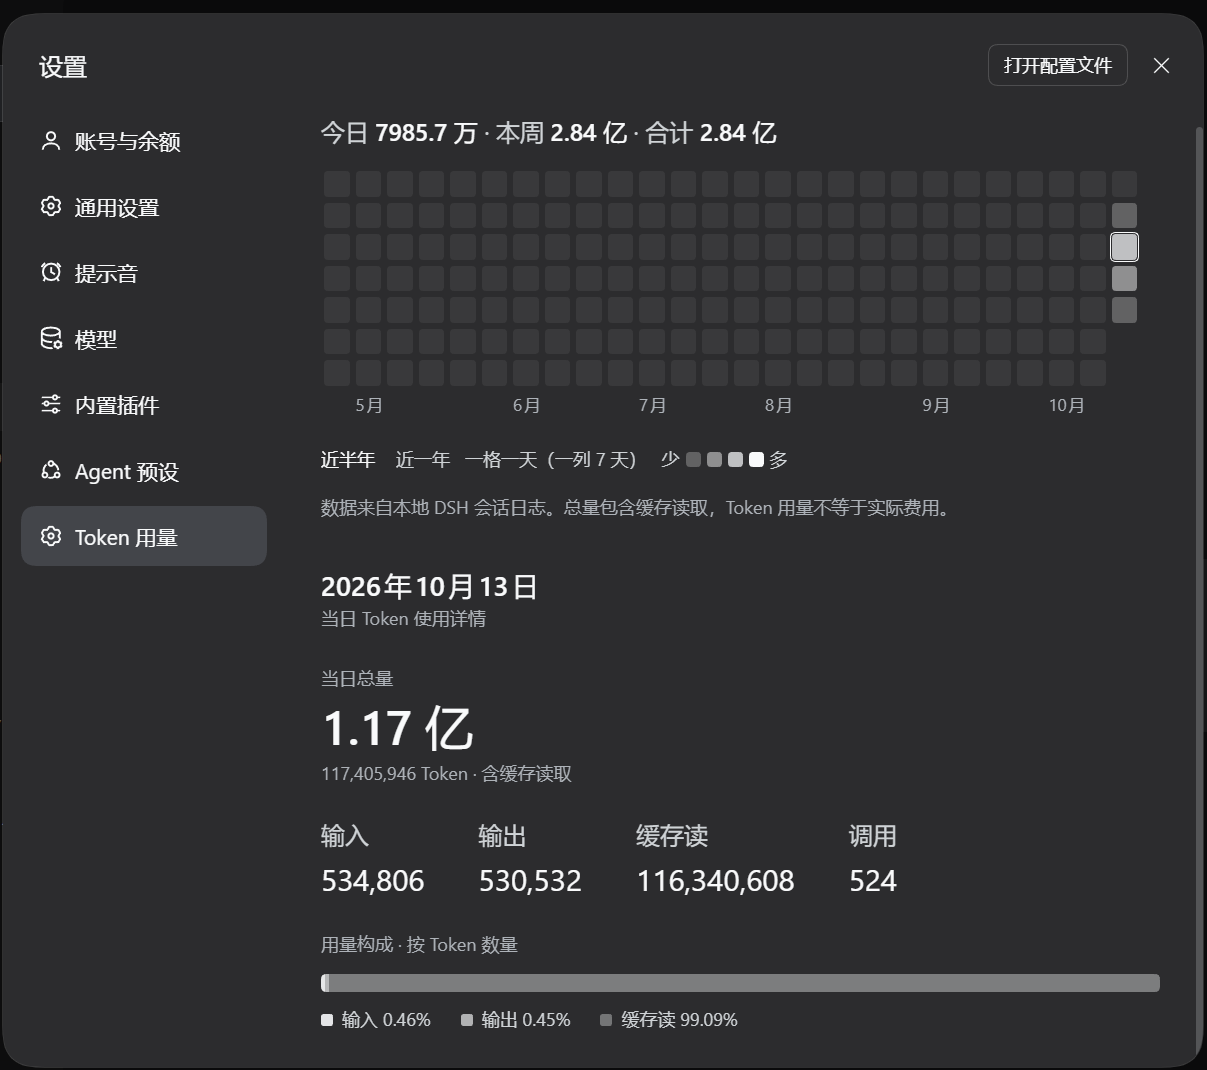
Labels, months, dates and number units follow the host language. The same daily total appears as “1.17 亿” in Chinese and “117.41M” in English.
Features
- Default half-year range (26 weeks); full year uses two rows (27 + 26 weeks), each with month labels
- Cells capped at 20px with 4px gaps, sized to the container to avoid horizontal scrollbars
- Daily / Weekly views: daily levels or one shared level per natural week; Sunday–Saturday, future dates empty
- Four metrics: total / input+output / cache read / output, rendered in theme-aware grayscale
- Hover or focus shows the cell's date, the selected metric's Token count and a click hint; weekly counts are labeled
- Click a date for inline daily details below the heatmap: total, input, output, cache reads, calls, and nonzero cache writes; weekly cells open their actual day
- Selecting the selected date again collapses the detail body while retaining its selection outline; an expand control and
Escboth collapse, and selecting another date switches without an intermediate collapse - Proportional Token composition bar with percentages and an empty state
- Approximately 600ms diagonal entrance without delaying the summary; filters and date selection do not replay it
- Native buttons support Enter/Space and focus feedback; respects system reduced-motion preferences
- Today / this week / all-time summary; minute refresh plus refresh on visibility or focus
- Chinese/English labels, month names and number units; follows the host light/dark theme
Data source
<DSH_HOME>/sessions/<project>/<session>/session.v*.jsonl.zstd
The plugin reads log records containing a valid timestamp and data.usage:
inputTokens / outputTokens / cacheReadTokens / cacheWriteTokens / totalTokens
plus time (epoch milliseconds) and data.message.source.model. Bucketing those by local calendar day gives the daily totals.
Three details that must be handled correctly:
- Logs contain concatenated zstd frames — the parser locates frame magic bytes and decompresses frames separately to retain readable frames.
- The same
seqcan appear more than once (replay) — deduplicate byseq, otherwise a day gets inflated. - A truncated frame can appear at the tail while a session is being written — skip that frame only, never drop the whole file.
Parsed results are cached by file size, modification time and aggregation time zone. New or changed files, and files whose aggregation time zone has changed, are parsed again.
About the metrics
Total includes cache reads reported in the logs; their share depends on usage. Input+output counts only those two fields. Token counts are not billed currency amounts; this plugin does not calculate costs.
Colour buckets use quantiles (25th/50th/75th percentiles of the local data set) rather than absolute thresholds, so the chart remains readable even though the four metrics differ by orders of magnitude.
Install
The desktop app's profile is managed exclusively by the app, and dsh plugin refuses to touch it, so install from inside the app:
- Open DSH → sidebar Plugins → Add plugin
- Enter the absolute path to this directory (the CLI form is
dsh plugin add "link:<path>") - Install, then restart the app
- Open Settings — a "Token Usage" entry appears in the navigation
Uninstall: open the bundle's card on the same page → Uninstall.
Configuration
Optional, set in the bundle row's config. Defaults apply when omitted.
| Key | Default | Meaning |
|---|---|---|
timeZone | Asia/Shanghai | Which time zone decides a "day" |
sessionsRoot | <DSH_HOME>/sessions | Session log root directory |
maxDepth | 2 | Directory depth to walk (project / session) |
Layout
| Path | Purpose |
|---|---|
lib/index.js | Host side: frame-by-frame decompression, daily aggregation, serves /dsh-token-heatmap/data |
client.js | Browser side: the React component registered into settings.section |
package.json | Manifest: dsh.bundle.patch for mounting, dsh.client for the browser half |
cordis.patch.yml | Mount declaration; the insert name must match the package name exactly |
tools/test-plugin.mjs | Runs the host-side aggregation over real session logs |
tools/test-apply.mjs | Runs apply() against a stub Cordis context to check route registration |
tools/test-client.mjs | Client rendering and interaction checks using React hook stubs |
tools/test-host.mjs | Synthetic-log checks for frames, deduplication, caching and time zone changes |
tools/test-weekly.mjs | Verifies weekly aggregation: week boundaries, month ticks, no double counting |
Use a Node.js version supporting node:zlib / zstdDecompressSync (Node.js 24 recommended). Client and weekly tests need no session logs. npm test uses deterministic fixtures and host stubs. npm run test:logs reads local logs; set DSH_SESSIONS_ROOT to override the path.
Self-tests:
npm ci
npm run check
npm test
npm run test:logs
Formatting is defined by .editorconfig and Prettier. Run npm run format to format the repository and npm run check to check formatting and entry-point syntax. Prettier is a development dependency only.
Implementation notes
The UI goes through a slot, it does not inject DOM. The component registers into settings.section and only renders React elements. It imports no Harness client package and writes its own styles primarily using host theme tokens. (The DSH plugin guide explicitly forbids appending to document.body or replacing the app root.)
Adaptive sizing. A ResizeObserver measures the container and computes each cell's edge length into the CSS variable --dth-cell. Sizing fits 26 columns for the half year and at most 27 columns per row for the year, capped at 20px and accounting for gaps and padding.
Week alignment. The range starts 25 or 52 weeks before the Sunday of the current week, so every column is a complete natural week, and cells after today stay empty. Month labels are placed on columns containing the first day of a month, with an additional label at each row start.
Localization. Visible text is never hardcoded. The plugin registers its own dictionary namespace with ctx.locale.register(ns, { zh, en }) and reads it through the framework's injected t seat, so a language switch re-renders the section. Number units are localized too (万/亿 in Chinese, K/M/B in English).
Client checks execute client.js with React hook stubs, covering the first visible render, compact tooltips, inline details, range switching and composition. They do not replace layout, animation, focus or theme verification in DSH.
See CHANGELOG.md for changes.
License
MIT
Comments
Loading…
Similar plugins
by xinmo114514
DSH(DeepSeek Harness)Web 插件:设置页 Token 消耗仪表盘 —— 指标卡、近 7 天/逐时趋势图、按模型/会话分布,数据全部来自本机会话日志,零外部请求。
★ 0
Unlicense
TypeScript
Aug 15, 2026
dsh plugin --profile web add dsh-usage-dashboardby fakeNihilist
Whole-corpus token usage statistics for DSH: daily and cumulative tokens, cache hit rate, per-model breakdown, and a year-long activity heatmap.
★ 0
MIT
JavaScript
Sep 24, 2026
dsh plugin --profile web add dsh-plugin-usage-statsby GIN0076
📊 Token usage dashboard for DeepSeek Harness Settings — daily/weekly/monthly per-model token stats with line & bar charts. Local-first, zero deps, pure SVG. DSH 设置面板词元用量统计插件
★ 0
MIT
JavaScript
Oct 1, 2026
dsh plugin --profile web add @local/token-usageby IZRINO
DeepSeek Harness token usage statistics plugin (DSH plugin): all-session hourly/daily/weekly/monthly aggregation with multi-series SVG charts. | DeepSeek Harness Token 用量统计插件:全部会话按小时/天/周/月聚合,多序列折线图区分输
★ 0
MIT
JavaScript
Aug 17, 2026
dsh plugin --profile web add dsh-token-statsby Amer-CN
非官方 DSH 插件:在 DeepSeek Harness 设置页渲染全量会话的 Token 用量统计——日历点阵热力图、多模型趋势折线、刻度环仪表盘,支持深浅主题与自定义时间范围。
★ 1
↓ 33/wk
MIT
JavaScript
Sep 13, 2026
dsh plugin --profile web add zcode-usage-statsby zhangzheng25
DeepSeek Harness plugin: token usage & conversation stats as a native settings page - today / 7d / 30d totals, GitHub-style 90-day contribution graph, session-log backfill | DeepSeek Harness 插件:Token
★ 6
↓ 447/wk
MIT
JavaScript
Aug 16, 2026
dsh plugin --profile web add dsh-token-monitor