

dsh-cache-hit-monitor
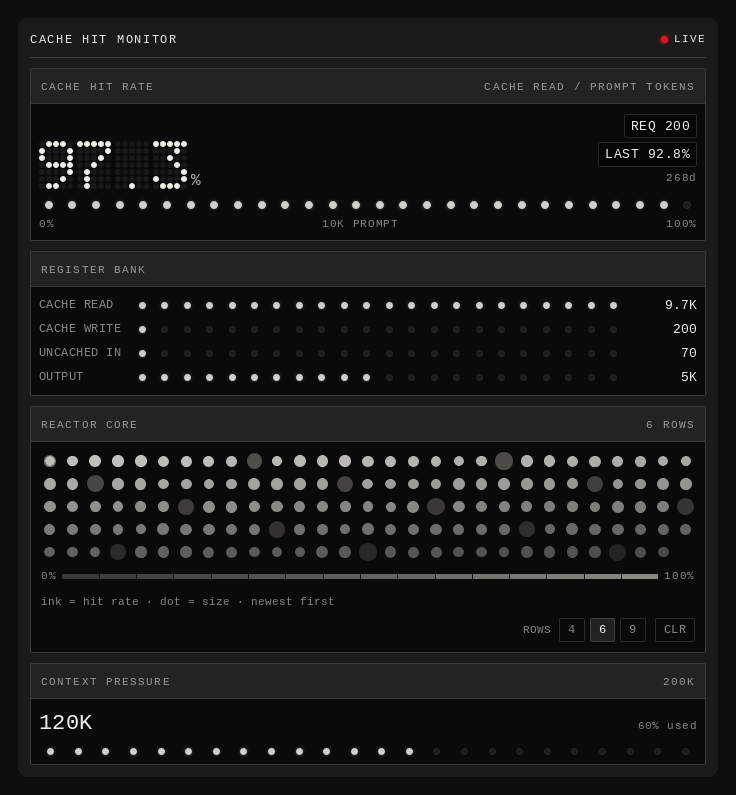
Manifest validLive prompt-cache telemetry for the current session in the DSH right sidebar: a register bank, a dot-matrix hit rate and a reactor-core history board.
Cache Hit Monitor
Live prompt-cache telemetry for the current session, drawn as an instrument panel in the DSH right sidebar.



English · 中文说明
What it does
The plugin adds one tab to the DSH right sidebar. It reads the tokenUsage and
contextPressure session projections the Host already publishes and shows them
as four flat instrument faces:
| Face | Shows |
|---|---|
| Hit rate | Session cache-hit rate as a 5×7 dot-matrix percentage, plus the settled request count, the last request's rate, that request's age and a 28-lamp bar against the current prompt total. |
| Register bank | The four disjoint cache buckets — cache read, cache write, uncached input, output — with session totals and proportional lamp rows. |
| Reactor core | One cell per settled request, newest first. Ink is that request's cache-hit rate, diameter is its size against the heaviest request on the board, and the field fades with age. |
| Context pressure | Pressure tokens against the context window. |
The tab opens by itself once per page load, so the panel is on screen without hunting through the tab guide. It closes like any other tab.
How the hit rate is calculated
hit rate = cache read / (cache read + cache write + uncached input)
Output tokens are deliberately excluded. Generated tokens are never cacheable, so counting them would flatter the number — a long generation would make a cold prompt look warm.
The reactor core in detail
One cell is one request that settled while the panel was mounted, ordered newest-first from the top left. The board is one whole number of rows at all times, and it is never taller than the history it actually holds, so a young session shows a short row rather than a large empty lattice.
- Ink — the request's hit rate, on a single-hue intensity ramp.
- Diameter —
sqrt(request tokens / heaviest request on the board), which keeps small requests visible next to a cold burst. - Fade — older cells dim toward the bottom of the board.
Each cell carries a title with its exact read / write / uncached / output
split, so the picture can be audited rather than trusted.
Install
From GitHub
dsh plugin --profile web add github:Billwu18/dsh-cache-hit-monitor
Or install it through the Plugin Manager in the Web UI.
Manual, for development
git clone https://github.com/Billwu18/dsh-cache-hit-monitor
dsh plugin --profile web add /absolute/path/to/dsh-cache-hit-monitor
Then reload the page. The Host re-reads plugin artifacts by modification time,
so edits to client.js are picked up by a refresh — no dsh web restart.
Requirements
- DSH
>=0.1.7-rc.1 <0.2.0-0 - Node
>=20(only for the test harnesses; the plugin itself runs in the browser) - React 18 or newer, which the DSH Web UI provides
No dependencies, no build step, no install scripts.
Reading the instrument
- A filled red dot next to the title means at least one request has settled in this session; an empty ring means nothing has been recorded yet.
- The register bank shows session totals, not per-request values. Its lamps are proportional to the largest bucket on screen.
- The core legend (0 % → 100 %) is the ink ramp, so a cell's brightness can be read back as a number.
- ROWS 4 / 6 / 9 sets the maximum board height in rows. The width is chosen by the sidebar itself: the panel measures how many columns fit and the board grows into whole rows, so the same history fills more rows in a narrow sidebar than in a wide one.
- CLR clears the recorded history for the current session. It does not touch any Host-side data.
How it works
The Host half is deliberately inert (index.js exports an empty apply). It
exists so the bundle has a Loader row and can be enabled, disabled and inspected
like any other plugin.
Everything the panel shows is already computed on the Host:
@deepseek-ai/dsh-token-meter
folds the durable session log into the tokenUsage and contextPressure
projections. The Client half reads them from its slot props via useProjection
and renders.
The client bundle is a single file (client.js) in the DSH browser-module
format. It uses only React and standard browser APIs:
- The board measures its own column count from the live layout with
getComputedStyleplus aResizeObserver, and re-renders once before paint. If the measurement is unavailable the board simply grows with the data instead of being capped. - The clock for the "age" readout lives in its own component and ticks at the resolution it prints (1 s / 5 s / 30 s), so an idle panel is not reconciling the whole board once a second.
- Recorded history lives in a bounded module-level cache keyed by session, so it
survives the remount that a tab switch causes. The tab is also registered with
keepMounted: true, which prevents that remount in the first place.
Privacy
The panel reads local session projections. It makes no network requests, sends no telemetry, and stores nothing outside the browser tab. Clearing history touches only in-memory state.
Compatibility
| DSH | >=0.1.7-rc.1 <0.2.0-0 |
| Platform | web (dsh.client.platform) |
| React | 18 or newer (provided by the host) |
| Themes | Both. The instrument faces are intentionally dark in both themes; the surrounding chrome follows the --dsw-* theme tokens. |
| Locales | English and Chinese. Other locales fall back to English. |
| Hosts | Any host that provides the sidebarRightTabs service. |
Development
No dependencies are required to work on this plugin — the tests run on plain
Node against the real client.js.
node test/run-all.mjs     # all four suites
node test/preview.mjs     # writes HTML that can be screenshotted
Repository layout
dsh-cache-hit-monitor/
├── client.js              the entire browser half (React, DSH module format)
├── index.js               the host half (intentionally inert)
├── cordis.patch.yml       the Loader row that installs the plugin
├── package.json           manifest: dsh.bundle + dsh.client
├── icon.svg               plugin card artwork
├── screenshots.json       storefront screenshots, relative to this file
├── locale/
│   ├── en.json            plugin card title and description
│   └── zh.json
├── assets/                screenshots referenced by the READMEs
└── test/
    ├── run-all.mjs        runs every suite below
    ├── preview.mjs        renders the panel to standalone HTML
    ├── wiring.test.mjs    bundle identity, effects, tab and slot registration
    ├── render.test.mjs    the rendered tree: shapes, counts, no NaN, key coverage
    ├── persist.test.mjs   history and depth survive a remount
    └── robust.test.mjs    adversarial inputs and locale coverage
How the tests work
There is no DOM and no test framework. Each harness stubs
window.__ModuleLoader__ to capture the bundle, stubs react, applies the real
apply(ctx) against a stub context, then drives the registered component with a
small renderer.
That is enough to assert real behaviour: which services the plugin injects, what
it registers into which slot, how many cells and lamps the tree contains, that
history survives a remount, and that no reachable input produces a thrown
exception or leaks undefined/NaN into a style string.
| Suite | Asserts |
|---|---|
wiring | Module id, declared injects, ctx.effect registrations, the tab definition (including keepMounted), both keyed slot registrations, and that the body is a component. |
render | Rendered tree shape: dot-matrix dots, reactor cells and cell dots, bar lamps, register rows, exactly one red element, no undefined/NaN in any style, and that every element in an array has a React key. |
persist | A real per-instance hook runtime: record a request, change the depth, unmount, remount — history, depth and keepMounted all confirmed. |
robust | 16 adversarial scenarios (missing or throwing projection, NaN/Infinity/negative/string token counts, no session id, no translate seat, empty to 10 000 events) must all render, and every locale key must exist in both dictionaries. |
License
MIT © 2026 Billwu18
Comments
Loading…
Similar plugins
A right-side session stats panel showing average cache-hit rate, session cost, runtime, request count, cumulative tokens and account balance.
★ 0
dsh plugin --profile web add dsh-session-stats-panelby cute-baobao
DeepSeek Harness usage recorder plugin: per-model hourly token usage (input/output/cache hits) with a stacked bar chart dashboard in the Web GUI.
★ 3
↓ 124/wk
MIT
TypeScript
Aug 14, 2026
dsh plugin --profile web add @dsh-usage-meter/usageby sqs404
DeepSeek Harness sidebar cache hit-rate widget (dsh-plugin): live context-cache hit ratio, segmented hit/miss/write bar, rate-state coloring, last-call rate. 侧边栏缓存命中率显示插件
★ 0
MIT
JavaScript
Aug 16, 2026
dsh plugin --profile web add @deepseek-ai/dsh-client-ui-cache-hitby AKUSH99
Live DeepSeek API balance in the sidebar footer plus an always-visible bottom-right pill: status dot and amount, refreshed every 60 seconds, the API key is read from the local credential store and nev
★ 0
MIT
JavaScript
Aug 26, 2026
dsh plugin --profile web add dsh-balance-chipby gbeta
Draggable ring gauge showing live model output speed (tok/s) with an expandable per-step detail panel (exact speed, TTFT, cache-hit rate, cache read/write, reasoning and input tokens, model, cumulativ
★ 1
MIT
JavaScript
Sep 3, 2026
dsh plugin --profile web add dsh-token-speedby lmmzss-jk
Balance and live session usage for the DSH web UI: header balance button (left of the Session log), dropdown with account balance, real-time token breakdown (cache miss/hit, cache write, output), cach
★ 1
↓ 109/wk
MIT
JavaScript
Aug 18, 2026
dsh plugin --profile web add @lmmzss/dsh-plugin-balance