
dsh-cap-profile
Manifest validPer-model capability profiling for DSH: turns local session history into per-model dashboards of session counts, tool usage, error rates, and top error signatures, with time-range filters and multi-mo
dsh-cap-profile
模型能力画像面板——DSH(DeepSeek Harness)插件。
为什么
会话跑得越多,越难回答「哪个模型在哪些事上稳、哪些事上老翻车」。翻原始日志太慢,人肉统计容易漏。
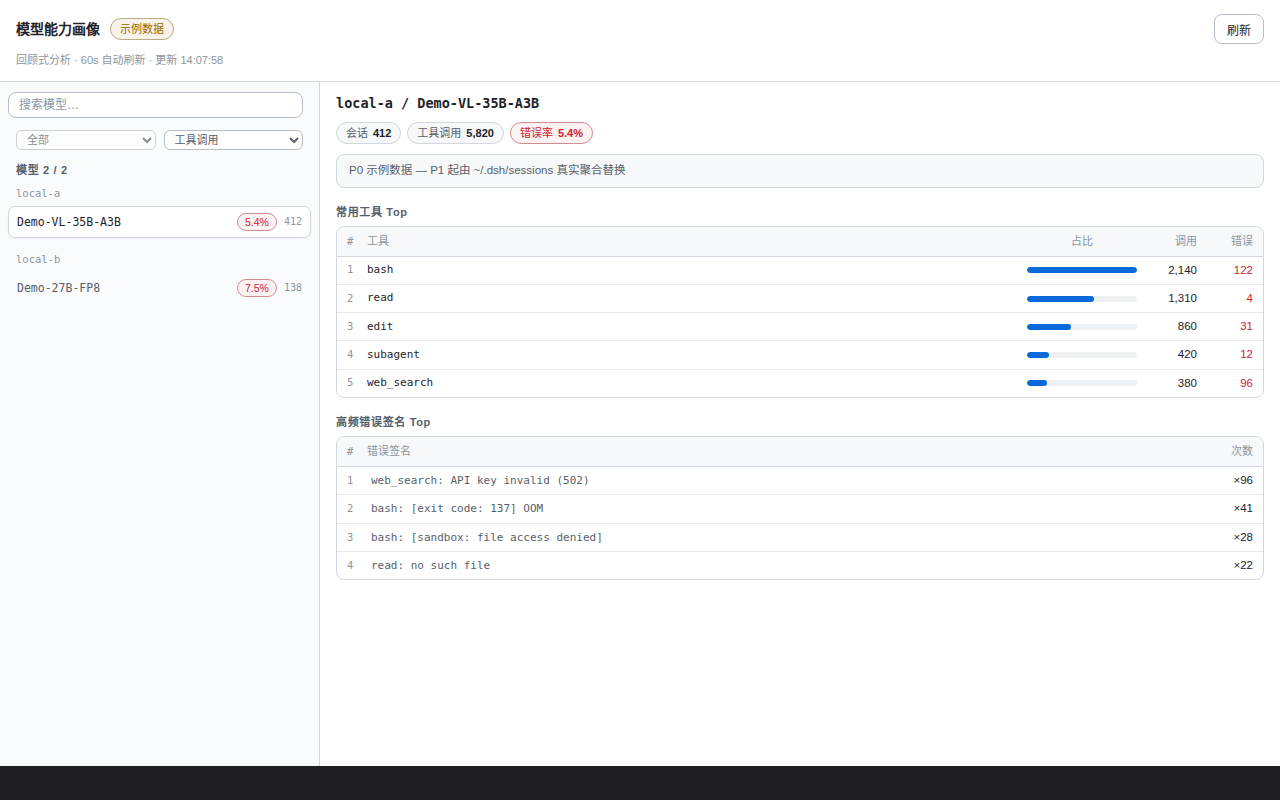
这个插件把 ~/.dsh/sessions 的会话历史做成画像,直接回答:每个模型的会话数、工具调用量、错误率、最爱用的工具和最高频的错误签名。
快速开始
前提:DSH(带 web)+ pnpm;Node ≥ 24(zstd 解码用 Node 内置 zstdDecompressSync)。
cd ~/.dsh/profiles/web                      # 你的 DSH web profile 目录
pnpm add github:Ansonfishing/dsh-cap-profile
然后在 package.json 的 dsh.profile.bundles 数组里加上 "dsh-cap-profile",重启 dsh。会话视图出现「能力画像」tab;首次打开触发后台首扫(大历史约 20s 级),期间先显示 mock 数据。
功能
- 模型对比表——每个模型(provider / model)的会话数、工具调用数、错误数、错误率。
- 工具 Top5 / 错误签名 Top5——每模型最常用工具(含 per-tool 错误率:0 灰 / <5% 琥珀 / ≥5% 红);归一化后的高频错误模式(如
bash: [exit code: 137] OOM),快速看出模型「易翻车」面。 - 多模型对比(≤4)——勾选多个模型进入对比视图:每模型一张卡片,卡内收敛指标对照(best/worst/top 标色)、工具 Top-10 矩阵、高频错误 Top-5、每日调用/错误趋势 mini 竖条(当日错误红色标注);有效勾选 <2 时自动回退单模型详情。
- 时间范围筛选——全部 / 近 7 / 近 30 / 近 90 天 / 今天 / 昨天(锚点 = 数据中最大日,对系统时钟漂移免疫)。
- 只读——只分析展示,从不修改会话数据;路由校验客户端头 + Origin/Referer,跨源请求 403。
- 增量缓存——per-file mtime 基线,后台 60s 增量 / 24h 全量;首扫未完成时路由不阻塞,回退上次缓存或 mock。
- 零运行时依赖——纯 Node.js。
不用装 DSH,先看看面板?
clone 本仓库,浏览器直接打开 test/harness/index.html——零依赖渲染 harness,?scenario=mock|live|empty|error 切换数据场景,?chrome=0 隐藏 harness 顶栏。
开发
npm test # node --test test/*.test.mjs
本地开发:clone 后在 profile 里用 pnpm add link:../path/to/dsh-cap-profile。客户端改动浏览器 F5 即可;Node 侧(index.js / lib/*.js)改动需重启 dsh。
许可证
MIT © Ansonfishing
Similar plugins
Metadata-first runtime profiler for DSH agents: turn/step traces, model and tool wall-time timelines, provider usage, retries, errors, and live or historical sessions.
★ 0
dsh plugin --profile web add dsh-devtoolsDSH Usage Monitor: auto-query provider credit balances and time-window limits from configured API keys, with input capsule and custom provider support.
★ 0
↓ 53/wk
dsh plugin --profile web add @lcthe/dsh-usage-monitorby cute-baobao
DeepSeek Harness usage recorder plugin: per-model hourly token usage (input/output/cache hits) with a stacked bar chart dashboard in the Web GUI.
★ 3
↓ 121/wk
MIT
TypeScript
Aug 14, 2026
dsh plugin --profile web add @dsh-usage-meter/usagePer-process tool-call statistics: a `tool_stats` tool reporting per-tool call counts, error counts, and average durations.
★ 0
dsh plugin --profile web add dsh-tool-call-statsPersonal toolbox for the dsh web profile with per-feature toggles: task-done desktop notifications, one-click restart, session deletion, plugin enable/disable, update checks, and UI utilities.
★ 0
↓ 137/wk
dsh plugin --profile web add dsh-toolsVendor-based usage dashboard: per-provider token/cache/output KPI, a 53-week heatmap, trend chart with hourly "today" view, model drilldown, cost estimation, CSV export, and health cards (TTFT, genera
★ 0
↓ 60/wk
dsh plugin --profile web add dsh-usage-vendor-stats