
dsh-needs-attention-sidebar
Manifest validHospital-triage board for the DSH sidebar: sessions whose latest turn ended in an error (red = fatal, amber = 429/rate-limit) or is waiting for approval are grouped under an Attention tab, next to Wor
@almazom/dsh-needs-attention-sidebar
English | 简体中文
A "Needs attention" block for the DeepSeek Harness (DSH) web sidebar — live triage of your agent sessions: what is working, what died, what needs your decision.



When you run many agent sessions, failures are quiet: a turn dies with a 429 or a fatal API error, and the session just sits there looking "open". This plugin gives those sessions a face. It injects a compact Focus block above the Workspaces section of the DSH web sidebar, with three tabs:
- Working — sessions with an open turn right now, with ticking durations.
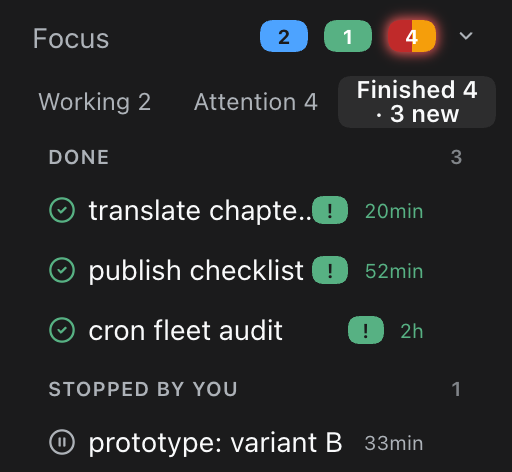
- Attention — sessions that stopped badly and need a human look: fatal errors (red), rate-limit/quota pressure (amber), blocked sessions awaiting approval (amber shield), and "look" states like a truncated
max-tokensreply or a hook abort. - Finished — sessions that completed (green), including ones you stopped yourself, with unseen
!badges and a· N newcounter.
Zero core edits: everything is a plugin — a server-side scan route plus a small client script that anchors into the existing sidebar DOM.
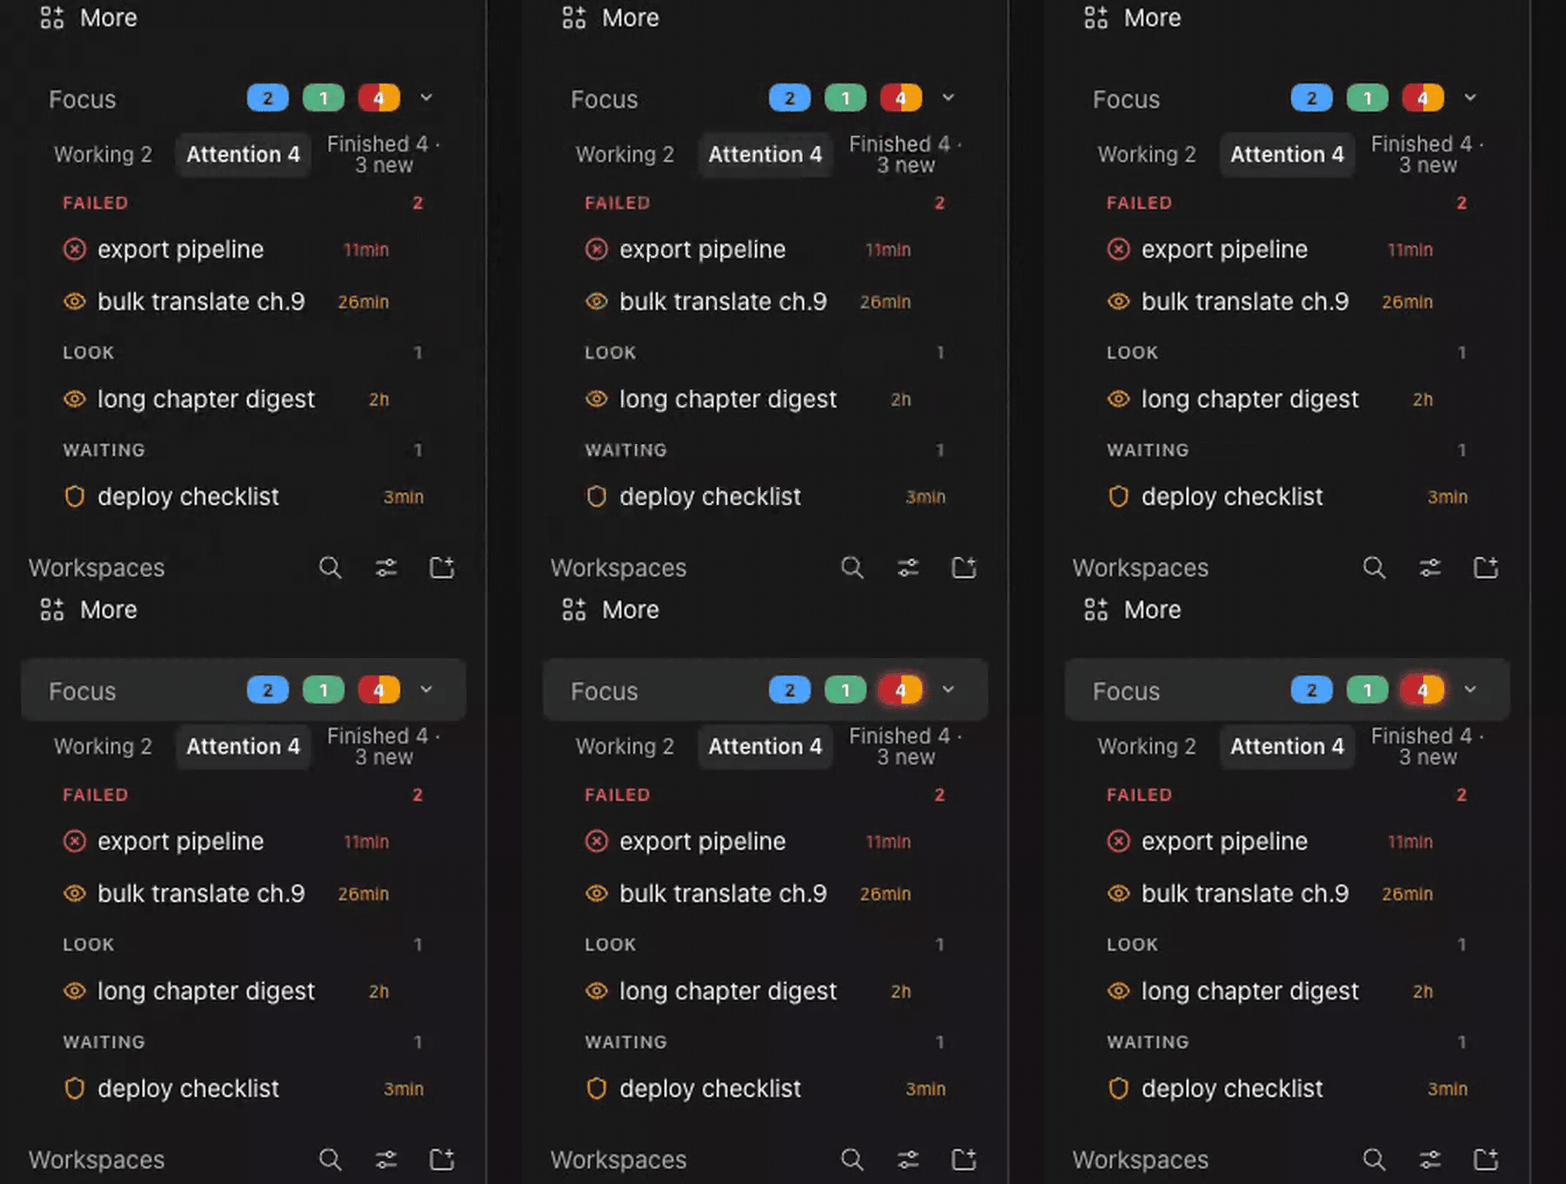
| In place | Attention | Working | Finished |
|---|---|---|---|
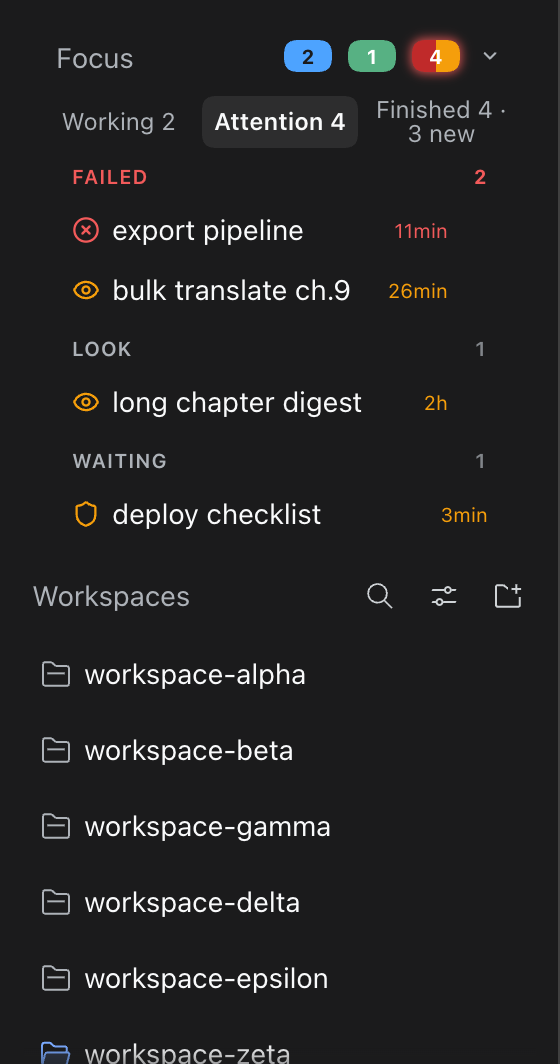 | 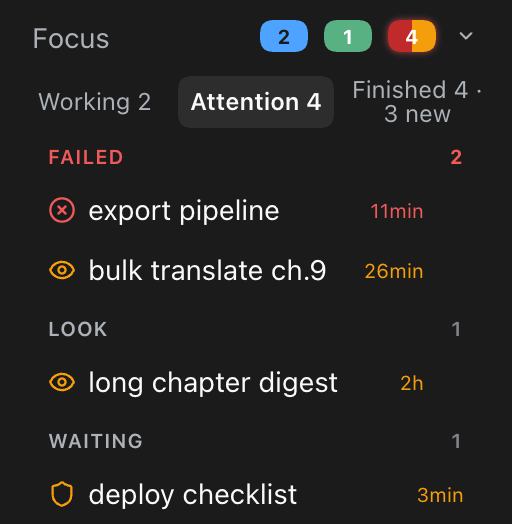 | 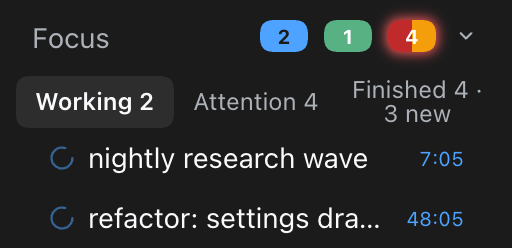 |  |
| Dismiss with undo | Long list, +2 more cap | Collapsed |
|---|---|---|
 |  |  |
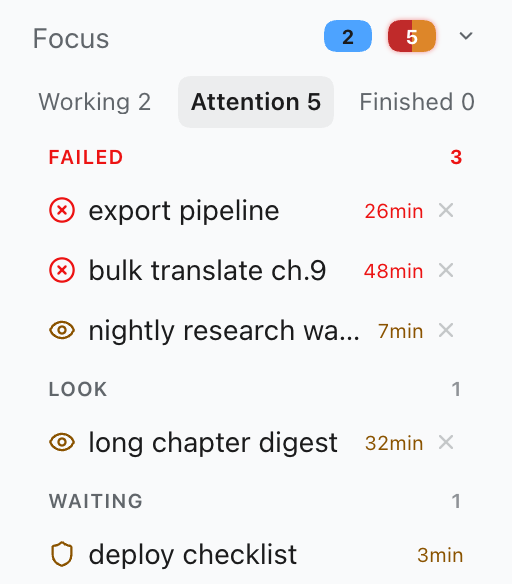 | Same block in the light scheme |
The idea
Agent harnesses are great at starting work and terrible at mourning it. A session whose last event is error: 429 Too Many Requests looks identical in the sidebar to one that is halfway through a two-hour refactor. You find out when you open it — or two days later.
The mental model is a hospital triage board, not a log viewer:
┌────────────────────────────────────────────────────┐
│  Focus                        [2]  [1]  [4]      ⌄ │
│  Working 2    Attention 4    Finished 4 · 3 new    │
├────────────────────────────────────────────────────┤
│  FAILED                                        2   │
│    ⊗  export pipeline                     11min    │   red   = fatal turn error
│    ◉  bulk translate ch.9                 26min    │   amber = 429 / quota / billing
│  LOOK                                          1   │
│    ◉  long chapter digest                   2h     │   amber = suspicious state,
│  WAITING                                        1  │           needs a human look
│    ⛨  deploy checklist                    3min     │   amber = approval unanswered
└────────────────────────────────────────────────────┘
Three design rules:
- The scan never costs a request you didn't make. The client polls the plugin's own route; the route scans session logs on request (no background daemon, no watcher), caches by file mtime, throttles responses to one scan per 20s, and gives up after 10s with
504 scan-timeout. An idle sidebar costs nothing. - Titles never leak secrets. Every row title passes a redaction pass (
sk-…keys,Bearer …tokens,token=…query shapes are stripped) before it leaves the server. - The harness stays untouched. The block is a client-side DOM injection above the existing Workspaces section; the only server surface is one read-only, admission-guarded plugin route. Uninstall = the sidebar looks exactly as before.
Install
Requires DSH >=0.2.0-rc.1 (checked at install time via engines.dsh).
Install straight from GitHub — no npm needed. In the DSH web UI open Plugins → Add plugin and paste the repository address, or run:
dsh plugin --profile web add github:almazom/dsh-needs-attention-sidebar
That's it. The command installs the package into the profile, and because the package declares dsh.bundle.patch, DSH auto-registers the plugin's cordis patch. Restart the web lane (or reload the page) and the Focus block appears above Workspaces.
Nothing appears? That is the design — the block shows itself only when something needs your attention.
Once the package is also published to npm, the package name works as an alternative:
dsh plugin --profile web add @almazom/dsh-needs-attention-sidebar
No build step, no lifecycle scripts, plain JavaScript — nothing runs on install.
Install in pictures
| 1. Open Plugins in the sidebar. | 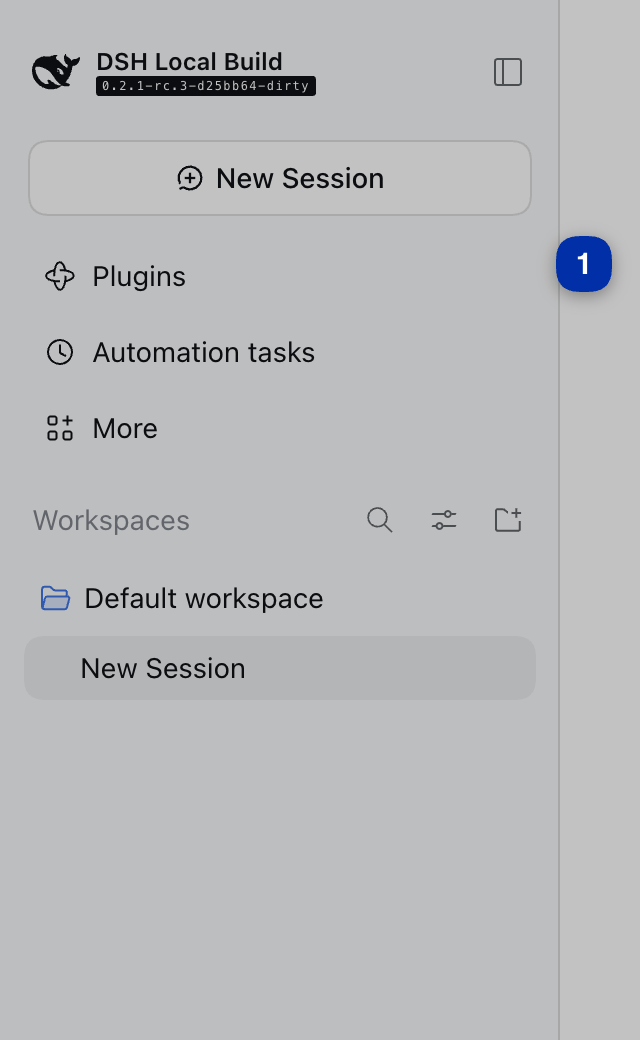 |
| 2. Click Add plugin. |  |
3. Paste github:almazom/dsh-needs-attention-sidebar and click Install. | 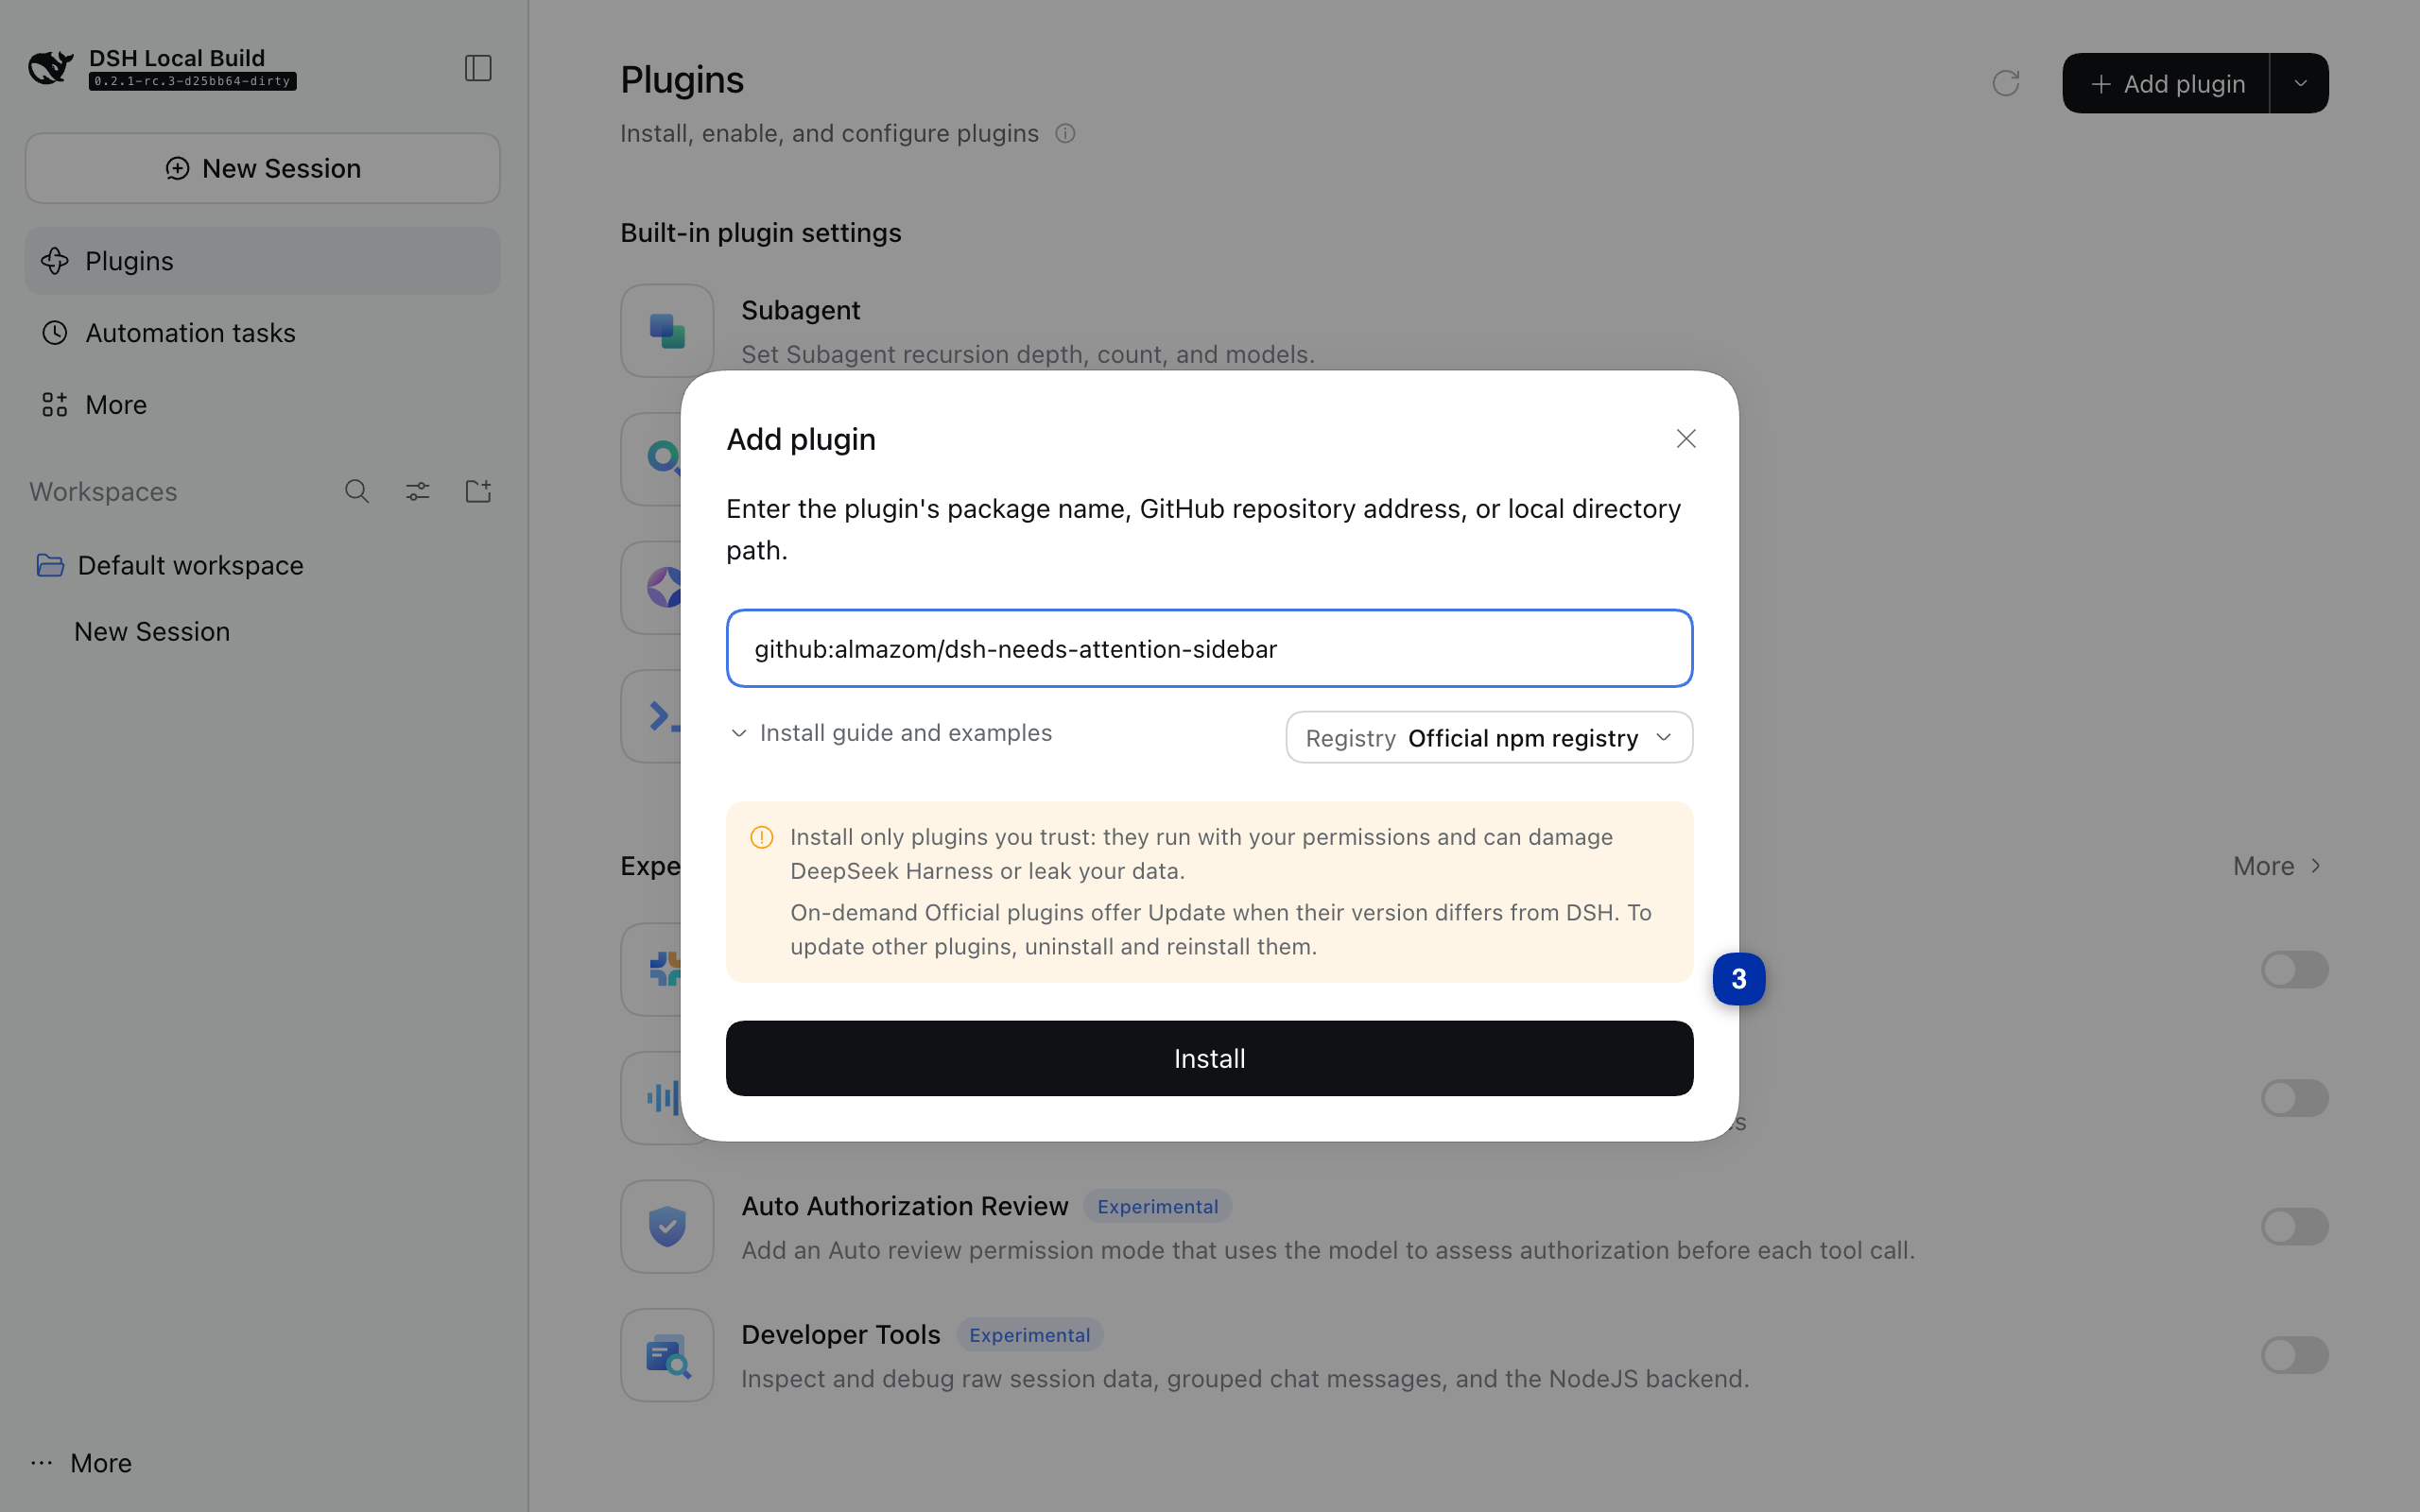 |
| 4. Confirm with Enable now. | 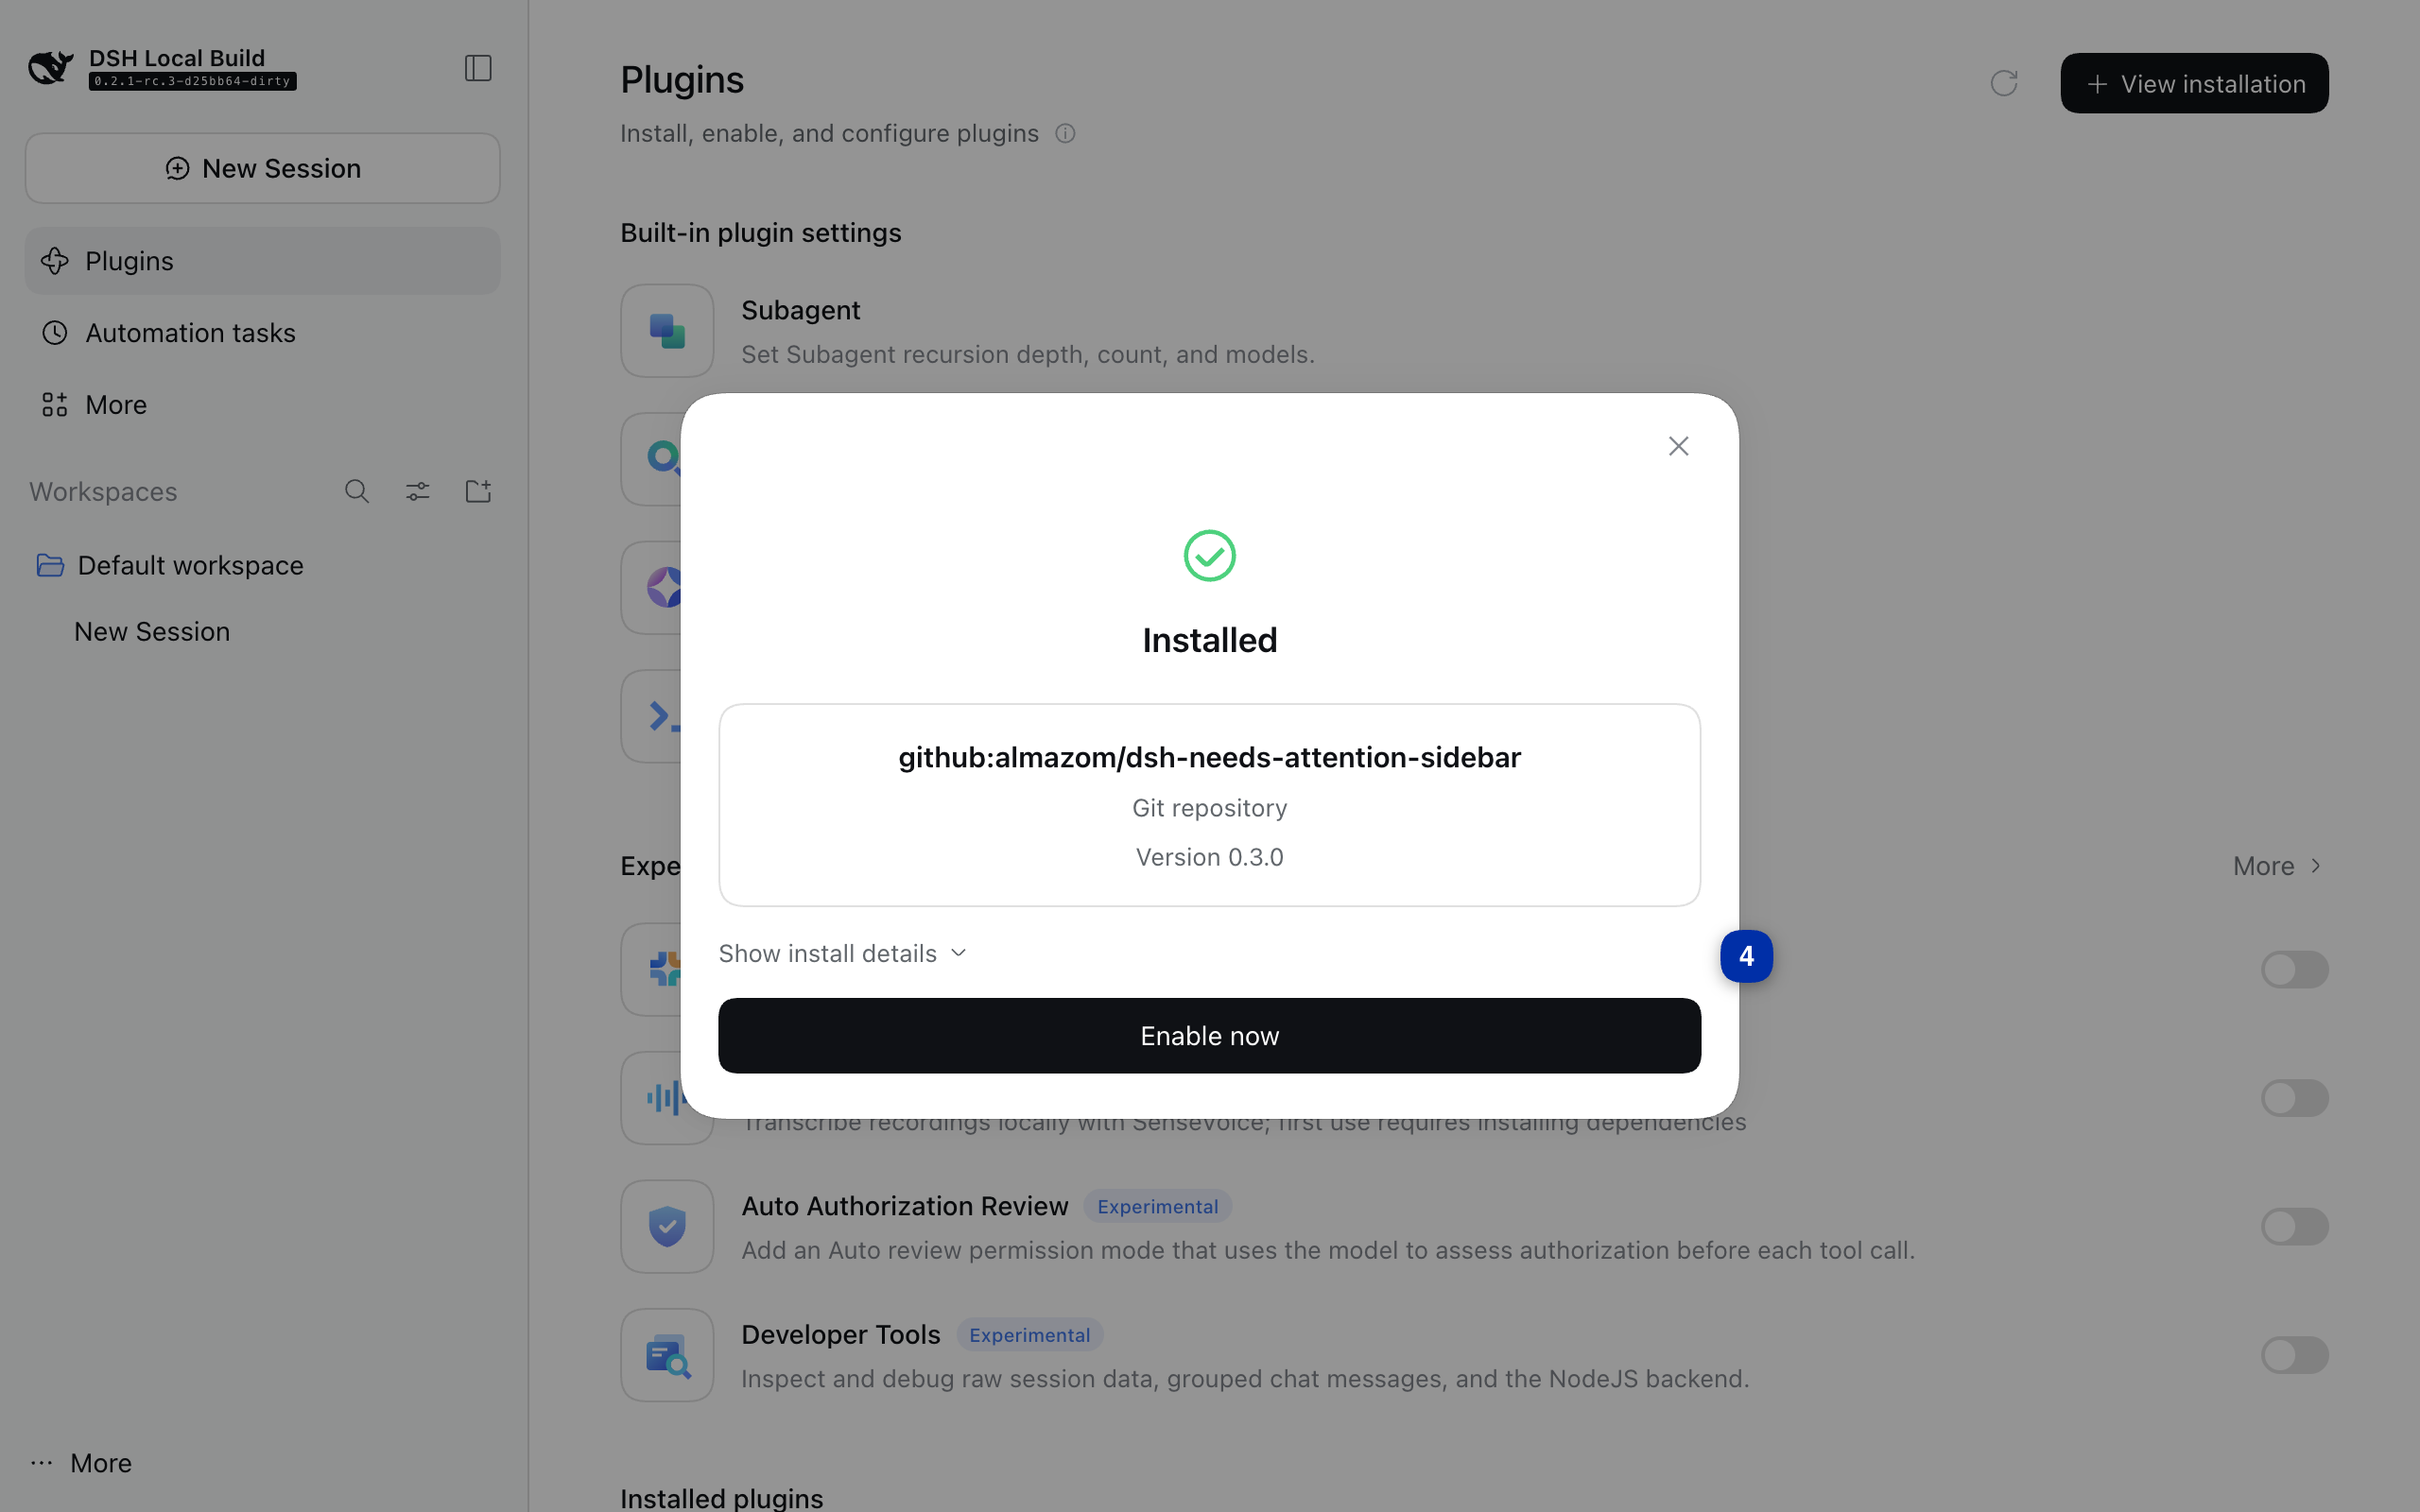 |
| 5. The plugin shows up under Installed plugins — and the Focus block is live in your sidebar. | 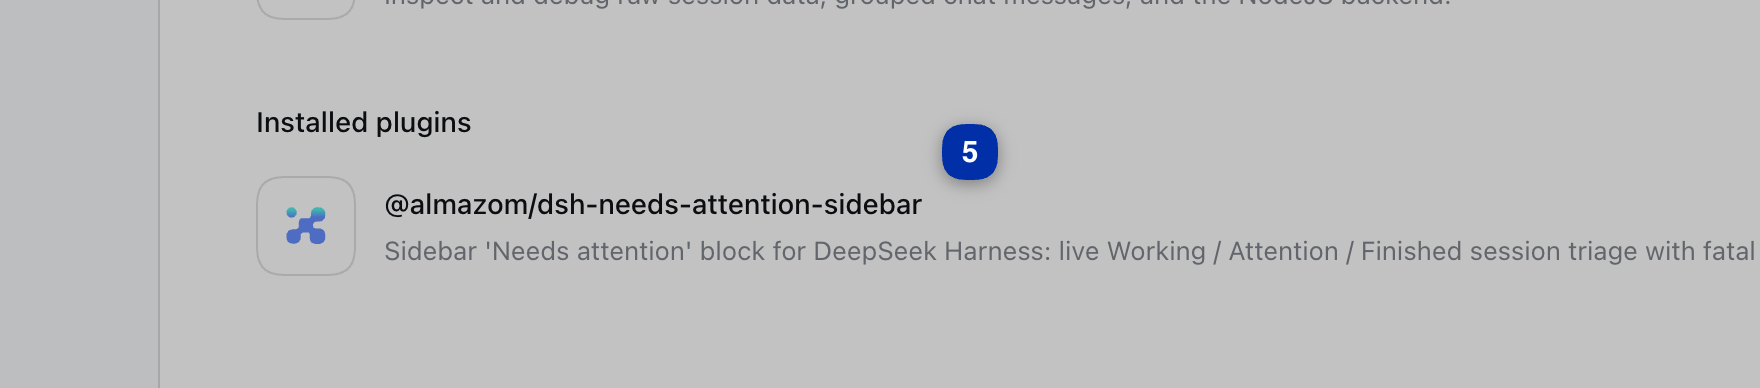 |
(All five shots are from a real install on a clean DSH 0.2.1-rc.3 instance — what you see is what you get.)
Dev channel (pre-release): the #dev branch carries the next version ahead of stable. Expect rough edges; the plain address above always points at the stable build.
dsh plugin --profile web add github:almazom/dsh-needs-attention-sidebar#dev
Upgrading
Install over the same URL (Plugins → Add plugin → paste the GitHub address, or dsh plugin --profile web add https://github.com/almazom/dsh-needs-attention-sidebar). The plugin remounts in place; your saved state (dismissals, collapsed head, last visit) is kept.
Reading the block
Header chips
[2] blue sessions working · [1] green sessions you stopped · [4] amber need attention. The chevron collapses the block to just the header row (persisted).
Tabs
- Working N — live sessions. Each row ticks its open-turn duration once per second.
- Attention N — warnings only, grouped:
- FAILED (red ⊗) — the session's last terminal event is a fatal turn error/abort (5xx, auth, model failure, 413 payload).
- LOOK (amber ◉) — states that usually mean degraded output or a stall:
blocked,max-tokenstruncation, hook abort, or rate-limit pressure (429 / quota / billing / 5-hour cap patterns → this amber "limit" class, not red). - WAITING (amber ⛨) — a tool/approval request has been sitting unanswered.
- Finished N · M new — completed (green ✓) and stopped-by-you (muted ⏸) sessions. Rows you have not opened since they finished carry a green
!badge ("new", not "alarm" — attention is the red/amber groups' job); a divider marks everything "since your last visit".
Row affordances
×dismisses a row (kept across reloads, with an Undo toast).- Every tab, group and row has keyboard focus and ARIA labels; the same actions work without a mouse.
Hide the session list (eye)
The fourth icon in the Workspaces header is an eye. Click it and the whole
session list folds away — the header stays, now reading Workspaces · N so you
know how many sessions are waiting. Click again (or press Enter/Space when
focused) to bring the list back. The choice persists across reloads; the icon
reflects the state (open eye = list shown, crossed eye = list hidden).
Fold the side navigation
If your sidebar has a Duty row, a small chevron appears at its right edge. Click it and the navigation rows (Plugins / Automation tasks / Duty) fold away to free vertical space; click again to unfold. No Duty row — no chevron: the feature stays out of the way on machines that don't use Duty. The fold is session-only: a page reload restores the navigation.
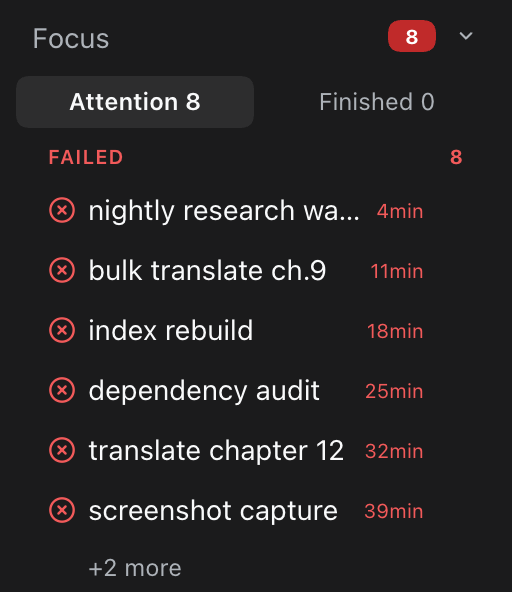
- If more rows exist than fit, the group scrolls with a
+N morecap (20 rows max per list — the scanner refuses to blow up your sidebar on a bad day).
What the scanner considers "recent"
Only sessions touched within the freshness window are scanned (default 12 hours, configurable). Older sessions are not your problem anymore; that's the whole point of the block.
Privacy & safety
- Local only. The scan reads session logs on your machine and serves them to your browser session. The route answers only the authenticated DSH web connection (exact-route admission guard; loopback fallback), rejects non-
GETwith405, and never caches (Cache-Control: no-store). - No telemetry, no external calls. The plugin makes zero network requests anywhere.
- Redaction at the server. Titles are redacted before serialization — key prefixes, bearer headers and token query parameters never reach the DOM.
- Read-only. The scanner only reads the harness session-log directory (
$DSH_HOME/sessions, default~/.dsh/sessions). It writes nothing.
Requirements
- DSH
>=0.2.0-rc.1 zstdon the web lane'sPATH(zstdcatis used to stream session logs; on macOS:brew install zstd)
Configuration
Environment variables (set them for the DSH web lane process, e.g. in its launchd plist or start script):
| Variable | Default | Meaning |
|---|---|---|
DSH_NEEDS_ATTN_WINDOW_H | 12 | Freshness window in hours (1–720). Only sessions modified within the window are scanned. |
DSH_NEEDS_ATTN_DEADLINE_MS | 10000 | Scan deadline. Past it the route answers 504 {"error":"scan-timeout"} instead of blocking. |
Under the hood
browser (client.js)                    dsh web lane (index.mjs → host.mjs → scanner.mjs)
──────────────────                     ──────────────────────────────────────────────
anchor: sidebar section label   poll   GET /api/dsh-needs-attention/sessions
  [class*="_sectionLabel"]  ──────────▶  admission guard (authenticated connection
inject <section> above                 or loopback) → 403 otherwise
  Workspaces                    ◀──────  on request: list recent session files
tabs / groups / ticks / unseen            (mtime cache, 20s throttle, single-flight)
dismiss + undo toast (localStorage)     zstdcat each file, tail-ring of 50 events
collapse / +N more / aria               → classify last terminal event + liveness
window.__DNA_STATUS__ diagnostics       → redact titles → rows (≤20), groups, counts
- Server (
src/scanner.mjs,src/host.mjs): one GET route. Streams only the tail of each session log (50-event ring), 6 files in parallel, per-file 8s timeout, event-loop yields so a scan never stalls the lane, 8MB/60s reuse cache for big logs. Classifies each session intoworking / waiting / look / fatal / limit / ok / stoppedusing the last terminal event plus liveness (open turn + recent file mtime). - Client (
src/client.js): a ModuleLoader factory that injects once, anchors on the existing section label (works across locales —Workspaces/工作区/Sessions/会话), polls 10s when there are rows / 30s when empty, and degrades gracefully against an older server (errors-only strip). - Wiring (
index.mjs,cordis.patch.yml): the plugin injectswebServer+connectionand registers its cordis insert. DSH discovers all of this frompackage.json— the core never learns this plugin exists.
Compatibility
| DSH | Status |
|---|---|
>=0.2.0-rc.1 | supported (enforced via top-level engines.dsh) |
The client carries a strip-states guard: paired with an older server build it falls back to an errors-only list instead of breaking.
Development
npm install        # dev only: nothing to build, plain JS
npm test           # 46 tests (node:test) — scanner, host route, client, wiring
index.mjs            host entry (name / inject / apply)
src/host.mjs         route + admission guard + deadlines
src/scanner.mjs      session scan, classification, redaction
src/client.js        sidebar injection + UI (vanilla JS, no deps)
cordis.patch.yml     cordis insert declaration
tests/               node:test suite
screenshots/         the images used by this README
Runtime dependencies: none (npm). The client is dependency-free vanilla JS; the server uses only Node built-ins plus the system zstd binary (see Requirements).
License
Comments
Loading…
Similar plugins
A status bar for the DSH sidebar. While a session runs, its row becomes a green card with a progress bar driven by an estimate of how long the turn will take (drifting dotted track), plus a live perce
★ 0
dsh plugin --profile web add dsh-session-barby dsh-plugin-collection
DSH 侧栏折叠分组聚合徽标:收起的文件夹行显示进行中/待审批/已完成/定时任务/等待评审的聚合状态,带数字与悬停明细。
★ 1
MIT
TypeScript
Nov 9, 2026
dsh plugin --profile web add dsh-group-statusby liuhusk
A permanent status card in the top-right corner of the DSH content area: one line for where this turn's time went (model, tools, waiting), plus collapsible to-dos with a progress bar, the session goal
★ 0
MIT
JavaScript
Nov 3, 2026
dsh plugin --profile web add @liuhusk/dsh-status-cardby mdktelmdktel
Live step pill in the DSH session header: folds the durable session event stream into the agent's current action (tool name plus its argument summary), the step index inside the running turn, the elap
★ 0
MIT
JavaScript
Nov 1, 2026
dsh plugin --profile web add dsh-agent-statusFolds streaming reasoning and tool calls into collapsed step bars and collapses each finished turn into a single summary bar; step bars show native tool icons, filenames, edited line counts, and failu
★ 0
dsh plugin --profile web add dsh-turn-foldby RGarvel
Channel-grouped session view injected into the sidebar — Workspace/Channels tabs with live-running dots, archived grouping, orphan tagging, built purely on official extension surfaces and serving as t
★ 1
↓ 53/wk
JavaScript
Nov 5, 2026
dsh plugin --profile web add dsh-channel-view