
dsh-token-usage
Manifest valid★ 1Adds a dedicated Token usage page to DSH with live per-session input, output, cache read, cache write and total counts, cache hit rate, a 14-day history strip, search and sortable columns; usage is re
dsh-token-usage
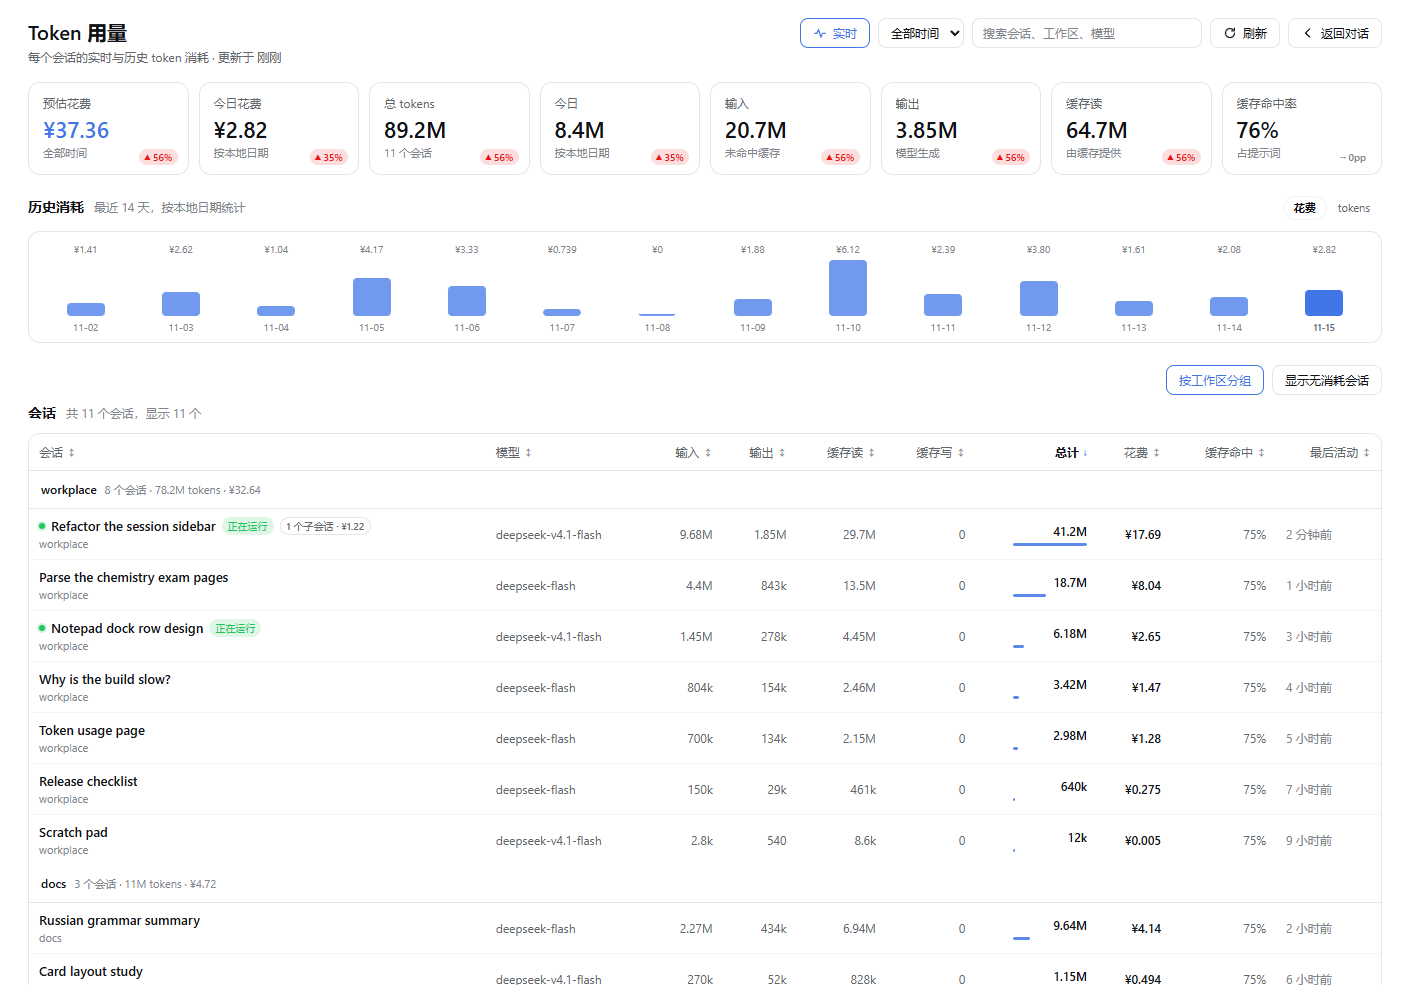
Live and historical token usage for every session in DeepSeek Harness — on one dedicated page.
What it does
- A real page, not an overlay. The plugin registers a global panel in the centre column, the same mechanism the Plugins page uses: opening it replaces the Conversation in the main slot instead of floating above it. Enter from the Token usage row in the sidebar and leave with Back to chat (or by opening any session).
- Live. Every durable session artifact is scanned incrementally — only the Zstandard frames appended since the previous poll are decoded. The page polls a same-origin route every two seconds and marks sessions that are still running with a green dot and a “running now” badge.
- History. A strip charts the last 7 / 14 / 30 local calendar days (the
choice is remembered in
localStorage); every session also keeps its own per-day buckets. - Sorting. Click any header to toggle ascending / descending: session, model, input, output, cache read, cache write, total, spend, cache hit rate, last active. Search filters by session, workspace, model, or id; sessions without usage stay hidden until you ask for them.
- Time windows. The header selector switches the summary and the table between today / last 7 days / last 30 days / all time, recomputed from each session's own day buckets.
- Trend badges. Every summary card carries a small pill in its bottom-right
corner —
▲56%or▼12%— green when the change is good, red when it is not (more spend or tokens is red, a higher cache hit rate is green, flat is→0pp). Hovering shows both values: a selected window compares with the window before it, all time compares the latest 7 days with the 7 before, and the two “today” cards compare with yesterday. - Exports. Three buttons above the table: CSV · sessions (the filtered, sorted table with raw integers and a UTF-8 BOM), CSV · days (daily totals for the selected range), and Copy table (a Markdown table ready to paste).
- Three chart forms. The history strip switches between bars, line, and pie (the choice is remembered) at one fixed height, so switching never jumps. Spend is split into peak and off-peak: a dashed peak line beside the off-peak area, two-tone stacked bars, or a two-slice donut. The header shows a “Off-peak · 1h 30m left” badge naming the window in force and the time until the next switch.
- Inline daily detail. The
▸at the left of a session row expands that session's per-day bars for the selected range (spend when priced, tokens otherwise) with aN days · tokens · spendtotal; expanding never opens the session. - Box aggregation. The grouping switch offers workspace / box / none. Box
data is read-only from dsh-session-boxes'
/session-boxes: a parent box contains its child boxes' sessions, ungrouped sessions come last, rows carry aparent / childlabel, and both CSV exports and the Markdown copy gain a Box column. A missing route, a 1.5 s timeout, or a malformed payload silently falls back to workspace grouping. - Workspace grouping and sub-sessions. Rows group under their workspace with
a subtotal; a subagent session folds into its parent as a chip
(
1 sub-sessions · ¥1.22) that expands inline. Grouping can be turned off. - Warm start. The fold is cached in
~/.dsh/token-usage-cache.jsonkeyed by artifact size and modification time, so a restart reads no session logs at all (2.3 s cold → ~7 ms warm). Any changed file falls back to an incremental read. - Numbers that mean something. Usage is folded exactly like the shipped
tokenUsageprojection: a final assistant settlement replaces the streaming sample of the same attempt, and a retried attempt is billed separately. - Estimated spend. Every attempt is priced at the moment it happened, so the
peak/off-peak window and the model of that request are honored: the built-in
table uses DeepSeek's official CNY list prices (Flash
0.02 / 1 / 4, Pro0.15 / 4.5 / 13.5per million cache-hit / miss / output tokens) with the Beijing peak window doubling every rate. Spend appears in the summary strip, as a sortable table column, and as the default history metric.
Configuration
None.
Overriding prices
The estimate is a reference figure, not a bill. Override the table by creating
~/.dsh/token-usage-prices.json:
{
  "currency": "CNY",
  "symbol": "¥",
  "peakMultiplier": 2,
  "models": [
    { "match": "minimax", "cacheHit": 0.3, "cacheMiss": 3, "output": 9 },
    { "match": "deepseek-v4-pro", "cacheHit": 0.15, "cacheMiss": 4.5, "output": 13.5 }
  ],
  "fallback": { "cacheHit": 0.02, "cacheMiss": 1, "output": 4 },
  "holidays": ["2026-10-01", "2026-10-02"]
}
Rates are per million tokens in currency; match is a case-insensitive
substring of the provider model name, longest match first. Every field is
optional — omitted fields keep their built-in value. holidays are the days
that bill at the off-peak rate all day; add each new year's statutory holidays
there.
Self-test
The plugin detail page (Settings → Plugins → dsh-token-usage) ends with a Self-test block that runs only when you press “Run self-test” — nothing is requested when the page merely opens:
| Check | Passes when |
|---|---|
/token-usage returns 200 | the same-origin route answers with JSON |
| Re-request with the ETag returns 304 | the first response's ETag is accepted (read-only probe) |
| Chart container renders | an offscreen bar chart mounts and produces DOM |
| Pricing table readable | payload.pricing carries a currency and peak multiplier |
Each check has a 2 s timeout, failures show their reason inline, and Copy
results produces Markdown (- [x] label — pass / - [ ] label — fail: reason).
Implementation
| File | Role |
|---|---|
index.js | Host half: incremental Zstandard frame reader over ~/.dsh/sessions, the usage fold, and the read-only /token-usage route. |
client.js | Browser half: the global panel, summary strip, 7/14/30-day history strip, sortable table, exports, and polling. |
The Host half registers no tool and adds no prompt content; it serves one read-only JSON route. Artifacts are decoded frame by frame, so a poll only reads what the Host appended since the previous one; restarts, truncation, and a half-written final frame each have their own handling.
Data colors come from the --dshc-* palette: :root carries the light set and
body[data-ds-dark-theme] overrides it with the dark one, so charts and the
peak/off-peak split never hardcode a hex value.
- What it does not do. The estimate prices uncached, cache-write, and cache-read prompt tokens from usage the provider reported; it does not read account balances, and it does not know a provider's private rates unless you override them.
- 304 uses size and modification time only. The poll's
ETaghashes each artifact's byte size andmtime. An external tool that rewrites a log in place to the same size and restores its originalmtimecould make a 304 serve stale content; the normal write path never does this, so no extra fingerprint is computed.
Development
node test/host.test.mjs          # host fold, incremental reader, pricing (no third-party deps)
pnpm add -D jsdom react react-dom
node test/page.dom.test.mjs      # runs the shipped client.js in jsdom: sorting, search, states
Install from GitHub
dsh plugin --profile desktop add github:879745uhjun/dsh-token-usage
Reload the Web UI page after installing.
License
MIT.
Comments
Loading…
Similar plugins
by iuuuuuuuu
DSH plugin: per-day token usage and time-to-first-token statistics, broken down by workspace and session. Reads local session logs only.
★ 0
MIT
JavaScript
Sep 16, 2026
dsh plugin --profile web add dsh-usage-statsby fakeNihilist
Whole-corpus token usage statistics for DSH: daily and cumulative tokens, cache hit rate, per-model breakdown, and a year-long activity heatmap.
★ 0
MIT
JavaScript
Sep 24, 2026
dsh plugin --profile web add dsh-plugin-usage-statsby solstice621
该仓库暂未提供项目说明。
★ 3
↓ 37/wk
MIT
JavaScript
Oct 30, 2026
dsh plugin --profile web add dsh-token-usage-dashboardby Lovenndme
A personal usage profile page in the DSH sidebar. Cumulative tokens drawn as an input / output / cache-hit donut, today's tokens, longest task time, active-day streaks, a 12-month activity heatmap wit
★ 59
↓ 4.7k/wk
MIT
JavaScript
Nov 16, 2026
dsh plugin --profile web add dsh-profile-statsby izz-BLUE
DeepSeek API usage dashboard for DSH Web: daily cache-hit/miss and output token statistics from session logs, per-model cost estimates, account balance, 7-day trends, and a composer usage summary.
★ 3
BSD-3-Clause
TypeScript
Aug 17, 2026
dsh plugin --profile web add @linxin666/dsh-deepseek-usage-dashboardby ChrisLou-bioinfo
DSH plugin: token usage statistics across all sessions as a settings page (zero-dep, no build)
★ 0
MIT
JavaScript
Oct 8, 2026
dsh plugin --profile web add dsh-usage-lite